


Table of contents:
Introduction.
Quantifying failure in non-stationary environments.
Model risks and limitations.
Formalism for failure.
A framework for principled adaptation.
Shifting-experts algorithm.
Meta-optimization dilemma.
Before you begin, remember that you have an index with the newsletter content organized by clicking on “Read full story” in this image.

Introduction
In our preceding discourse, we talked about the features of parameter-free optimization, a methodology designed to liberate quantitative strategists from the sinister task of parameter tuning. The allure was undeniable: escape the perilous cycle of tweaking lookback windows, volatility thresholds, and rebalancing frequencies—a process that often culminates in overfitted models, brittle constructs that perform pretty well in-sample only to disintegrate upon exposure to live market conditions. By excising these explicit parameters, the objective was to engineer systems with inherent robustness. Yet, an unsettling reality persists, one that we must now confront directly:
Every model possesses an implicit parameter—the market regime in which it was conceived.
A so-called “parameter-free” model is, in truth, inextricably linked to its developmental environment. It assimilates a collection of rules, statistical relationships, and dynamic behaviors from the dataset upon which it is trained. A market regime can be conceptualized as a distinct statistical properties:
Its volatility structure, the covariance matrix governing inter-asset relationships, the degree of autocorrelation present in its price series.
And its characteristic signal-to-noise ratio.
Consequently, a model trained during a placid era of low inflation and consistent economic expansion internalizes a set of assumptions—a market worldview—that may be invalidated when inflationary pressures mount and volatility becomes the dominant market force. A momentum strategy, for instance, honed in a trending, low-volatility bull market, is predisposed to systematic failure in a choppy, high-volatility, mean-reverting environment where every apparent breakout is a deceptive trap. The optimization problem has not been solved; it has merely been displaced to a higher, more abstract plane. The model is implicitly “optimized” for the statistical fingerprint of its training data.
Because of that, our focus shifts from the granular details of model parameters to the more encompassing and critical challenge of model adaptation. The primary risk we aim to dissect and mitigate is that of model-regime mismatch: the inevitable failure of a static model operating within a dynamic, non-stationary world. Conventional backtesting methodologies frequently compound this risk by fostering a hazardous form of analytical myopia. They assess performance using metrics that average across an entire historical timeline, such as the Sharpe ratio, Sortino ratio, or total compounded return. While these metrics may appear impressive, they can cover a dangerous truth: a strategy might have been exceptionally profitable for a five-year period before systematically bleeding capital for the subsequent two years.
This averaging effect is deceptive and represents the pivotal conflict we must resolve. A trader, after all, does not experience the “average” return; they live through the path-dependent, day-to-day fluctuations of their profit and loss. A strategy that incurs persistent losses for two years is not a viable strategy; it is a liability, irrespective of how stellar its long-term average performance appears on a backtest report.
The pivotal event that propels our entire research is the regime break—that critical juncture when the market fundamentally alters its behavior, when established rules cease to apply, often with startling abruptness and little to no forewarning.
Quantifying failure in non-stationary environments
The principal obstacle confronting the quantitative strategist is not the market’s innate propensity for change, but rather the inadequacy of our conventional tools for performance measurement. Our analytical arsenal is largely predicated on an implicit, and often unstated, assumption of stationarity—the notion that the statistical properties of the financial universe are stable and time-invariant.
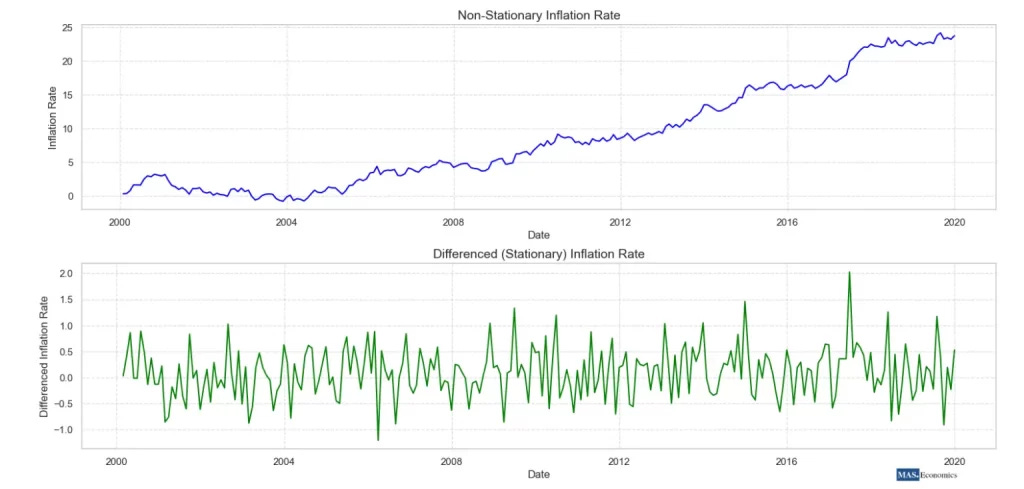
In the context of financial markets, this is arguably the single most perilous assumption one can make. Our task is to deconstruct this outdated paradigm and erect a new analytical framework from its foundations.
Let us ground this discussion in a concrete, quantitative examination. The standard operating procedure for evaluating a trading strategy involves computing a suite of performance metrics over a fixed historical period, for example, a decade. These metrics typically include the Sharpe Ratio, Calmar Ratio, Compound Annual Growth Rate (CAGR), and maximum drawdown. The fundamental, inescapable flaw in this approach is that these are global metrics. They perform an act of aggressive dimensionality reduction, condensing a rich, time-varying, path-dependent sequence of returns into a single, sterile numerical value.
To illustrate the severity of this issue, consider two hypothetical strategies, A and B, over a 10-year horizon:
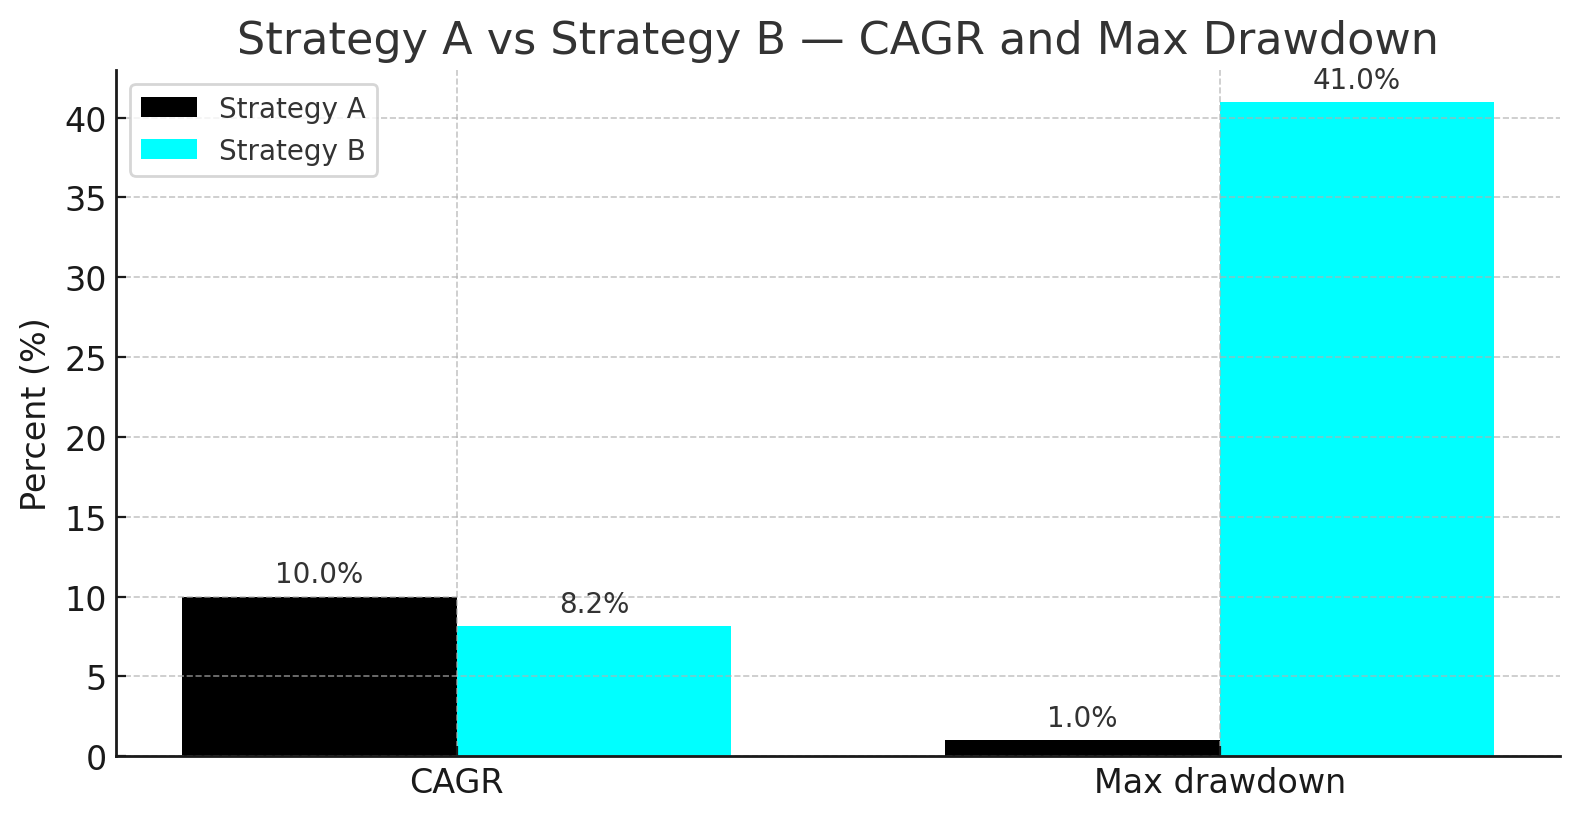
Strategy A: Generates a consistent, steady 10% return each year for the entire 10-year period. Its CAGR is precisely 10%. The maximum drawdown is negligible. The performance is smooth, predictable, and confidence-inspiring.
Strategy B: Delivers a spectacular 30% annual return for the first 5 years, followed by a painful -10% annual return for the next 5 years. The compounded total return over the decade results in a CAGR of approximately 8.2% (((1.305)×(0.905))1/10−1≈0.082). Its maximum drawdown, incurred entirely in the second half of the backtest, would be substantial, likely exceeding 40%.
When judged solely by the global metric of CAGR, Strategy A appears only marginally superior to Strategy B. However, any rational investor or risk manager would—and should—abandon Strategy B after year 6 or 7, as it would be demonstrably failing in the current market environment. A quantitative analyst who places blind faith in the 10-year CAGR of Strategy B is courting disaster by deploying a model that is actively destroying capital. The global metric has utterly failed to signal the regime break in the strategy’s performance. It has averaged a period of exceptional success with a period of abject failure, yielding a final assessment of “mediocre,” a descriptor that accurately characterizes neither period and provides zero actionable intelligence for capital allocation decisions today.
The obstacle is one of analytical perspective. We are conditioned by the conventions of quantitative finance to place our trust in these summary statistics.
They are convenient for reporting, for comparison, and for marketing. The first, most crucial step is to actively unlearn this reliance and begin to conceptualize performance as a local, not global, phenomenon. The key question is not How did this strategy perform over the last decade? but rather: How is this strategy performing now, and in the recent past?
We need to care more about the derivative of the equity curve than its final value. To visualize this, let’s plot the rolling Sharpe ratio of our two strategies. We will simulate daily returns to make the analysis more realistic.
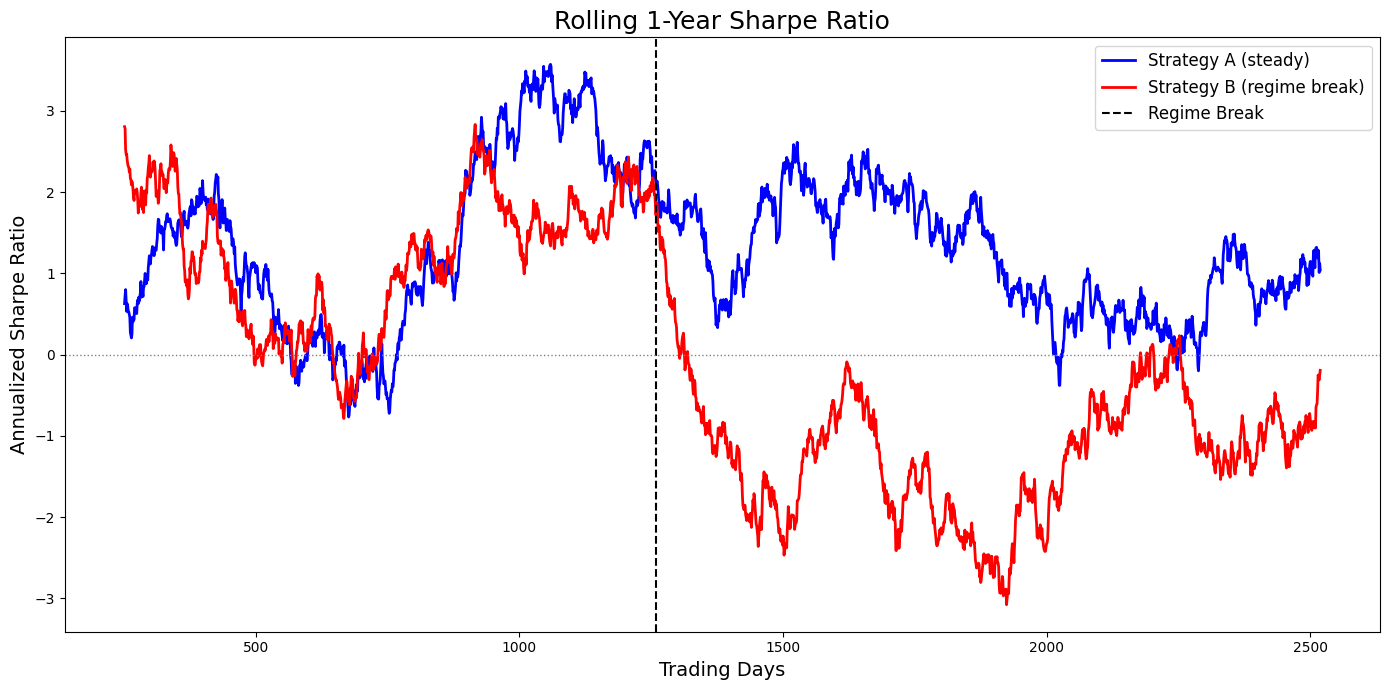
Judged by these numbers, Strategy B still looks somewhat viable, albeit inferior to A.
The plot, however, tells a different story. Strategy A’s rolling Sharpe ratio remains consistently positive and stable, oscillating around its long-term average. In stark contrast, Strategy B’s rolling Sharpe ratio is exceptionally high for the first five years and then plunges, remaining deeply and persistently negative for the second five years. The visual evidence is unequivocal: Strategy B is broken. The global metric, by averaging the good with the bad, commits a grievous error of misrepresentation. This visualization crystallizes the core problem: our tools are not designed to detect failure in real-time.
Model risks and limitations
Before continuing it’s important to be aware that adaptive regret framework has potential, but it is not infallible. A proficient quantitative strategist is defined not only by their models but by the awareness of their limitations. To deploy such a system without a rigorous understanding of its failure modes is to trade analytical hubris for financial ruin.
The single most critical limitation to internalize is that minimizing regret is not the same as maximizing risk-adjusted returns. The regret metric is a valuable proxy for adaptive capability, but it is not the ultimate objective function of a trading business, which is typically some function of PnL, volatility, and drawdown.
Achieving a small or even negative adaptive/dynamic regret provides a guarantee that your algorithm performed nearly as well as the best available sequence of experts. However, if all the experts in your universe lose money during a particular period (e.g., a market crash where all long-only strategies suffer), your low-regret portfolio will still lose money. The framework guarantees you’ll lose money efficiently, but it doesn’t prevent the loss itself.
The solution is not to discard regret but to supplement it with a dashboard of traditional risk and performance metrics. Never rely on regret alone. Continuously monitor rolling PnL, Sharpe/Sortino ratios, maximum drawdown, and turnover-cost drag. Implement hard-coded risk management overlays, such as a kill-switch that flattens the portfolio if a predefined maximum drawdown threshold is breached or if realized volatility spikes beyond a certain limit. Regret tells you about your relative performance; PnL tells you if you’re still in business.
Another important point is the choice of the mixing rate, α, places the strategist on a knife’s edge between two opposing risks.
A small α makes the aggregator conservative and slow to adapt. After a sharp, sudden regime break, it will continue to place weight on the old, failing paradigm for too long, leading to protracted drawdowns. Conversely, a large α makes the aggregator hyperactive and jittery. In a stable market regime, it will constantly overreact to noise, interpreting minor fluctuations as regime shifts, leading to excessive turnover and cost drag.
A way to mitigate this is to move beyond a static α. More advanced implementations can feature a time-varying mixing rate. For example, αt could be engineered to increase temporarily following a sharp spike in portfolio losses (a potential signal of a regime break) and then gradually decay back to a baseline level during periods of calm. An even more robust approach is a strongly-adaptive meta-aggregator, where multiple
FixedShareAggregatorinstances are run in parallel, each with a different fixed α (e.g., α∈{0,1/T,4/T,12/T}). A second-level aggregator then dynamically allocates weight to the aggregator that is performing best, effectively learning the optimal adaptation speed online.
The adaptive aggregator is a manager, not a magician. It can only allocate capital among the strategies you provide it. Its performance is fundamentally bounded by the quality and diversity of this expert universe.
This is the “Garbage In, Garbage Out” principle. If the market enters a new regime for which you have no corresponding expert strategy, no amount of intelligent re-weighting can save you. If your universe consists of ten different trend-following strategies, and the market becomes violently mean-reverting, the aggregator will simply pick the least-bad trend-following strategy as it cycles through losses.
If the expert strategies are highly correlated, the benefits of adaptation are severely diminished. The weight updates will cause the portfolio to bang between experts that are essentially providing the same information. This can lead to risk concentration, where the aggregator collapses its weight into one corner of a highly correlated cluster of experts, creating a portfolio that is far less diversified than the number of experts would suggest.
Finally, a host of risks arise from the gap between the clean mathematics of the algorithm and the finite, messy world of computer hardware and software protocols.
The core update involves exponentiation, which can be numerically unstable. With many experts or very large losses, the values can underflow to zero or overflow to infinity, causing the algorithm to fail. The calculation of dynamic regret via dynamic programming is computationally intensive, making it infeasible for real-time monitoring with a large number of experts or a long history.

Formalism for failure
To advance beyond this qualitative critique, we must introduce a more rigorous, mathematical language to define and measure performance in this dynamic context. The field of online machine learning provides an exceptionally well-suited concept: regret. Regret quantifies the performance of our chosen algorithm relative to some benchmark, typically an oracle that possesses information unavailable to us at the time of decision-making (such as knowledge of the future).
Let us consider a universe of N distinct trading strategies, which we will refer to as experts. These experts represent our fundamental building blocks—they are our candidate sources of alpha. For example, Expert 1 could be a 50-day moving average crossover system, Expert 2 a statistical arbitrage strategy on a pair of equities, and Expert 3 a volatility-selling strategy. At each time step t (e.g., each trading day), each expert i incurs a loss ℓi,t. For our purposes, it is convenient to define loss as the negative of the logarithmic return: ℓi,t=−log(1+Ri,t). A lower loss signifies better performance. Our master algorithm, or “aggregator,” must dynamically combine the outputs of these experts to form a portfolio, which in turn incurs a loss ℓt.
The classical formulation of regret is Static Regret. It is defined as the difference between the cumulative loss of our algorithm and the cumulative loss of the single best-performing expert in hindsight over the entire period T.
Let’s implement this method because we weill use it in the main script:
def static_regret(loss_agg: np.ndarray, loss_experts: np.ndarray) -> float:
   “”“
   R_T^static = sum_t loss_agg[t] - min_i sum_t loss_experts[t, i]
   “”“
   L_agg = float(loss_agg.sum())
   L_i = loss_experts.sum(axis=0)  # (N,)
   return L_agg - float(np.min(L_i))
The objective of many traditional online learning algorithms is to guarantee that this static regret grows sub-linearly with time. This is a theoretical guarantee, as it implies that on a per-period basis, the algorithm’s performance converges to that of the hindsight-optimal expert (RTstat/T→0 as T→∞). This sounds highly desirable: over a sufficiently long horizon, our algorithm will perform nearly as well as if we had possessed a crystal ball on day one, allowing us to select the single best strategy and commit to it for all time.
However, in the non-stationary data of finance, this is like science fiction. The single best expert is a static concept imposed upon the market. Let’s construct a simple simulation to demonstrate this catastrophic failure mode in action. We will model two experts: a momentum expert and a mean-reversion expert. The market will operate in a momentum-favoring regime for the first half of the simulation and then abruptly switch to a mean-reversion-favoring regime.
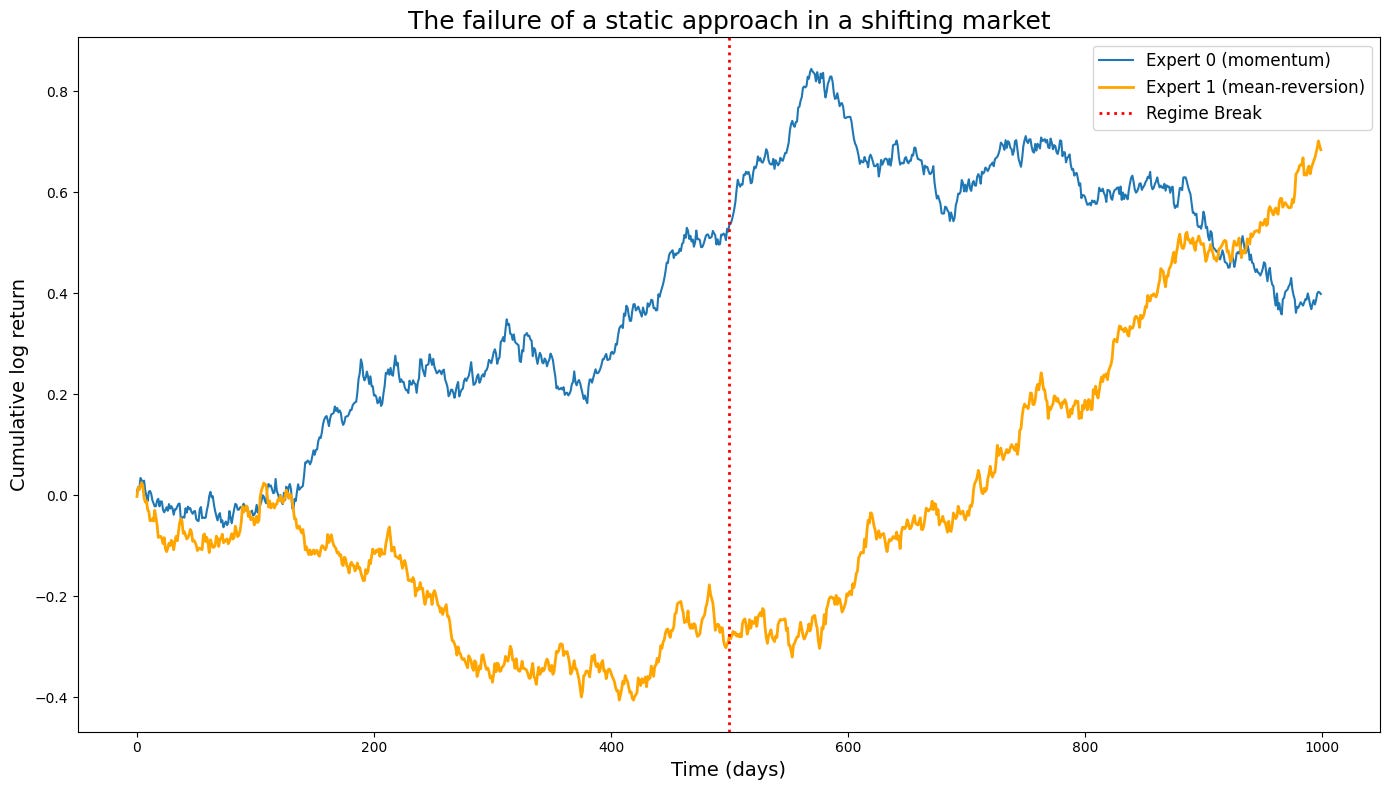
The resulting plot is a stark illustration of the problem. An algorithm optimized to minimize static regret would be judged against the performance of the orange line. Let’s say it successfully tracks this benchmark. What does that mean for the investor? It means the algorithm would have performed brilliantly for 500 days and then proceeded to systematically destroy capital for the next 500 days. The fact that its total static regret is low is cold comfort. The very benchmark we are using—the single best expert in hindsight—is an inappropriate and misleading target in a world that changes. Minimizing static regret forces our algorithm to find a compromise strategy, one that is mediocre on average but potentially catastrophic locally. This is the core analytical obstacle that must be surmounted. We need a better definition of success.
A framework for principled adaptation
The resolution to this dilemma lies not in building a better model, but in fundamentally changing the question we ask of it. Instead of asking, How can my algorithm perform as well as the single best strategy over the entire historical period? we must pivot to a more relevant and actionable question: How can my algorithm perform, at all times, nearly as well as whatever strategy is currently the best? This paradigm shift necessitates a radical overhaul of our mathematical framework and our algorithmic toolkit, moving from a static, global perspective to a dynamic, local one.
To construct a solution, we must first define the problem with precision. This requires the introduction of new performance metrics that explicitly capture the essence of adaptation and penalize failure within any time frame.
Adaptive (or interval) regret: This metric radically reframes the evaluation process. Instead of assessing performance over the entire history from t=1 to T, it examines every possible contiguous sub-interval [r,s] within that history. It measures the maximum regret our algorithm incurs over any such interval. Mathematically, it is defined as:
\(R_{\text{interval}}^{\text{adapt}} = \max_{0 \le r \le s \le T} \left\{ \sum_{t=r}^{s} \ell_t - \min_{i=1,\ldots,N} \sum_{t=r}^{s} \ell_{i,t} \right\}\)An algorithm that achieves low adaptive regret provides an exceptionally strong performance guarantee. It promises that no matter which window of time an analyst chooses to examine—be it the last week, the last month, the last quarter, or the tumultuous period surrounding a specific economic event—the algorithm’s performance was nearly as good as the best possible strategy for that specific period. This is a profound improvement. It means the algorithm cannot conceal a period of disastrous performance behind a long history of prior success. It is held accountable for its performance locally in time, which is precisely what any rational risk manager or investor truly cares about. An algorithm with low adaptive regret would not have been permitted to bleed capital for 500 days, as we saw in our previous example, because its regret over that specific 500-day interval would have been enormous.
To implement this part we will use:
def interval_regret_windows(
        loss_agg: np.ndarray,
        loss_experts: np.ndarray,
        windows: List[int] = [20, 60, 120]
    ) -> Dict[int, float]:
        “”“
        Adaptive (interval) regret restricted to fixed window lengths.
        Returns max over all starting t for each window W:
          max_t sum_{s=t}^{t+W-1} loss_agg[s] - min_i sum_{s=t}^{t+W-1} loss_experts[s, i]
        “”“
        T, N = loss_experts.shape
        P_agg = np.concatenate(([0.0], np.cumsum(loss_agg)))
        P_exp = np.vstack((np.zeros((1, N)), np.cumsum(loss_experts, axis=0)))

        out = {}
        for W in windows:
            if W > T:
                out[W] = np.nan
                continue
            worst = -np.inf
            for t in range(0, T - W + 1):
                L_a = P_agg[t + W] - P_agg[t]
                seg = P_exp[t + W] - P_exp[t]  # (N,)
                best_expert_seg = float(np.min(seg))
                regret = L_a - best_expert_seg
                if regret > worst:
                    worst = regret
            out[W] = worst
        return out
Dynamic (or shifting) regret: This metric elevates the concept one step further. It compares the algorithm’s performance not to a single static expert, nor even to a sequence of interval-best experts, but to a pretty interesting benchmark that is permitted to switch between the available experts a predetermined number of times. Our benchmark is no longer a single entity but an optimal sequence of experts. If we allow for S switches over the total period T, the dynamic regret is defined as:
\(R_{S,T}^{\text{dyn}} = \sum_{t=1}^{T} \ell_t - \min_{u_1, \ldots, u_T \in \{1, \ldots, N\}^T \text{ with } \le S \text{ switches}} \sum_{t=1}^{T} \ell_{u_t, t}\)Here, the sequence u1,…,uT represents the choice of expert at each time step, and the minimization is over all possible sequences that contain at most S changes (i.e., where ut≠ut-1). Dynamic regret is perhaps the most intellectually honest metric for measuring adaptive performance. It explicitly acknowledges that the optimal strategy is not fixed. It asks, How did my algorithm perform compared to a clairvoyant competitor who knew the perfect sequence of momentum → mean-reversion and was allowed to make that one switch at the perfect time?
Crucially, as we will see in our implementation, this hypothetical switching benchmark can be (and should be) charged a transaction cost for each switch it makes, creating a truly robust and fair comparison. If our algorithm can achieve low dynamic regret against this formidable, cost-adjusted benchmark, we can possess a high degree of confidence in its genuine adaptive capabilities.
def dynamic_regret(
        self,
        loss_agg: np.ndarray,
        loss_experts: np.ndarray,
        S: int,
        include_costs: bool = True
    ) -> float:
        “”“
        Dynamic (shifting) regret vs best comparator sequence with up to S switches.
        Returns:
          R_T^dyn(S) = sum_t loss_agg[t] - min_{u sequence, ≤S switches} sum_t loss_{t, u_t} [+ switching_costs]
        If include_costs=True, comparator pays 2*lam per switch (L1 distance between expert one-hots).
        “”“
        T, N = loss_experts.shape
        lam = self.lam if include_costs else 0.0

        INF = 1e100
        DP = np.full((T, N, S + 1), INF, dtype=float)

        # init at t=0
        for i in range(N):
            DP[0, i, 0] = loss_experts[0, i]

        # transitions
        for t in range(1, T):
            for i in range(N):
                li = loss_experts[t, i]
                # stay with i (no new switch)
                for s in range(S + 1):
                    DP[t, i, s] = min(DP[t, i, s], DP[t - 1, i, s] + li)
                # switch from j != i (pay 2*lam)
                for j in range(N):
                    if j == i:
                        continue
                    for s in range(1, S + 1):
                        DP[t, i, s] = min(DP[t, i, s], DP[t - 1, j, s - 1] + li + 2.0 * lam)

        best_comp = float(np.min(DP[T - 1]))
        return float(loss_agg.sum()) - best_comp