


…

Before you begin, remember that you have an index with the newsletter content organized by clicking below.

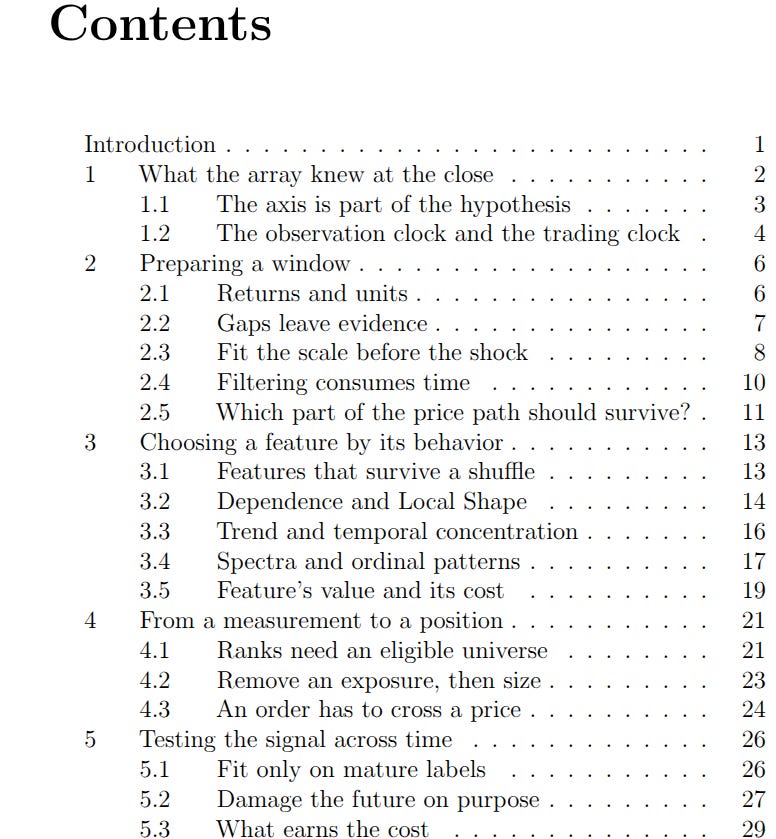
From raw market data to preprocessing and signal
Preprocessing shapes what a trading strategy measures. Choices about missing prices, scaling, and sampling can change a signal even when the underlying observations are identical. The first task is to establish what was available at each decision time. From there, the researcher prepares the data, selects features that express a specific hypothesis, and turns those measurements into portfolio positions. Execution timing, trading costs, and validation then determine how the results should be interpreted. The aim is to keep the economic meaning and information timeline visible through every transformation.
What’s inside:
Establishing what was known at the decision time: Distinguish when an event occurred from when its value became available, including subsequent revisions. Define the time and asset axes, distinguish observation counts from elapsed time, and track stale quotes. These choices determine which information a historical trading decision could have used.
Preparing the history while preserving the evidence: Choose appropriate return units, account for corporate actions, and keep records of missing observations and outlier treatments. Estimate scaling and clipping thresholds from the intended historical baseline. Account for smoothing delays, and choose fractional differencing or detrending according to the price behavior the research needs to preserve.
Choosing features for the behavior they measure: Connect measurements of dispersion, dependence, trend, cycles, and recurring patterns to a specific market hypothesis. Check how each feature responds to changes in scale or observation order. Its sample requirements, undefined outputs, and computational cost also determine whether it suits the intended use.
Turning measurements into portfolio positions: Specify why a feature should imply a particular trading direction before ranking or combining it with other measurements. Restrict comparisons to assets eligible at the time, remove selected factor exposures, and size the portfolio. Recheck those exposures after position limits and other practical adjustments change the weights.
Testing the signal across time: Split evaluation by decision date and fit parameters using information and completed outcomes available before each cutoff. Change future inputs deliberately to check that earlier signals remain unchanged. Compare against simple benchmarks under the same trading conditions, account for dependence when estimating uncertainty, and record the alternatives tested.
Following a complete trading experiment: Combine path efficiency and short-term reversal in a simulated twelve-asset universe. Select the blend before the holdout, neutralize sector exposures, and execute at the next opening price. Track drifted holdings, turnover costs, and final liquidation to see how the signal translates into net returns under the experiment’s assumptions.
Applying the notebook to another dataset: Begin with a small window whose calculations can be checked by hand, then extend the analysis to multiple assets and fields. Preserve array axes and rolling-window endpoints so features remain attached to the correct dates. Choose calculations the available history can support, and retain validity masks to keep missing or undefined results visible.