Table of contents:
Introduction.
Dilution analysis.
Income.
Balance.
Cash flow.
Ratios.
Segment.
Audio Note: Before we begin, remember that if you’re accessing this article through the Substack app, you can listen to it instead of reading it. The MarketOps section is best suited for this format.
Before you begin, remember that you have an index with the newsletter content organized by clicking on the image below.
Introduction
We are opening a new subsection inside MarketOps dedicated to small-cap opportunities. The goal of this series is to analyze companies that may be overlooked by the broader market but still present interesting financial, operational, or strategic characteristics for investors. This first report marks the beginning of that new series!!!
Rush Street Interactive, Inc. (ticker: RSI) is an online gambling and sports betting company operating within the Consumer Cyclical sector, specifically in the Gambling industry. RSI should be analyzed as a digital gaming operator whose value depends on its ability to grow revenue, retain users, improve margins, and manage dilution in a highly competitive and regulated market.
The company’s business is centered on online casino gaming, sports betting, and related digital wagering products. Unlike traditional casino operators, RSI does not depend primarily on physical casino properties, hotel capacity, or destination traffic. Its business model is more closely tied to digital platform performance, market access, customer acquisition, regulatory approvals, payment infrastructure, product experience, and player retention. This gives RSI a different investment profile from land-based gambling businesses.
The main attraction of RSI is its exposure to the continued legalization and expansion of online gambling. As more jurisdictions allow regulated online betting and iGaming, companies with existing platforms, licenses, and operating experience can expand their addressable market. Growth in this industry requires significant spending on marketing, promotions, compliance, technology, and customer support.
RSI’s investment case depends on four main areas:
Revenue quality.
Margin expansion.
Balance sheet strength
Dilution control.
Strong revenue growth is valuable only if it leads to better operating leverage and cash generation. Improving EBITDA is useful, but investors should also examine net income, operating cash flow, free cash flow, and the difference between adjusted and reported profitability.
Overall, RSI can be introduced as a small-cap digital gambling company with exposure to a structurally growing industry, but also with meaningful execution and capital structure risks. The company operates in an attractive market, but its investment value depends on whether management can convert market growth into sustainable profitability and improved per-share value. For that reason, RSI deserves a detailed analysis across dilution, income statement quality, balance sheet position, cash flow generation, operating ratios, and segment performance.
All information and data presented in this article have been sourced from the QuantX platform.
Dilution analysis
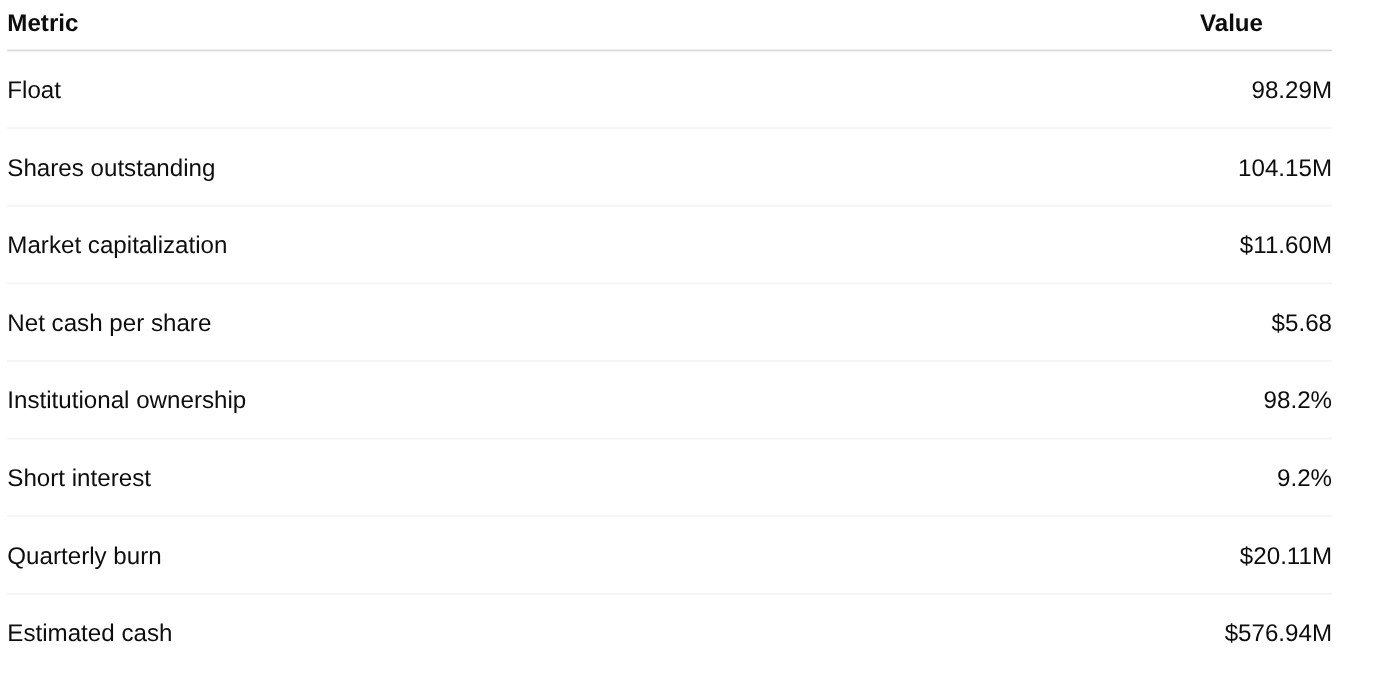
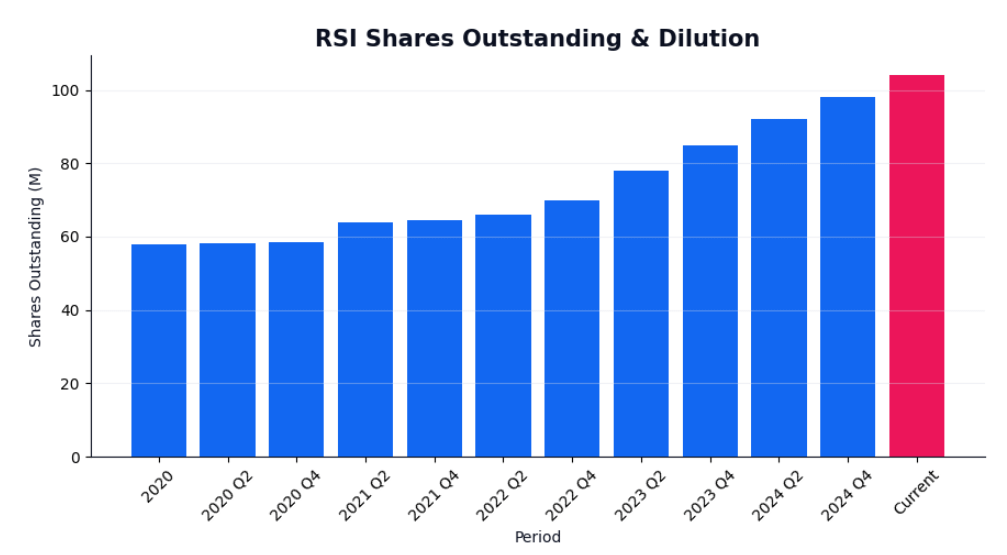
Rush Street Interactive’s dilution profile is a relevant part of the equity analysis because the company has a meaningful public share base and a visible increase in shares outstanding over time. The dilution panel shows 104.15 million shares outstanding and a float of 98.29 million shares, which means that most of the company’s share base is already available for public trading.
The first important observation is that RSI is classified with medium overall dilution risk. The share-count chart shows a clear upward trend from roughly 58 million shares in 2020 to 104.15 million shares currently. That increase is material from a shareholder perspective because the ownership base has expanded over the period shown.
The chart shows that RSI’s share count increases in a gradual way. A company can increase revenue, improve its operating footprint, and expand into new markets, but if the share count also rises materially, the economic benefit must be measured on a per-share basis.
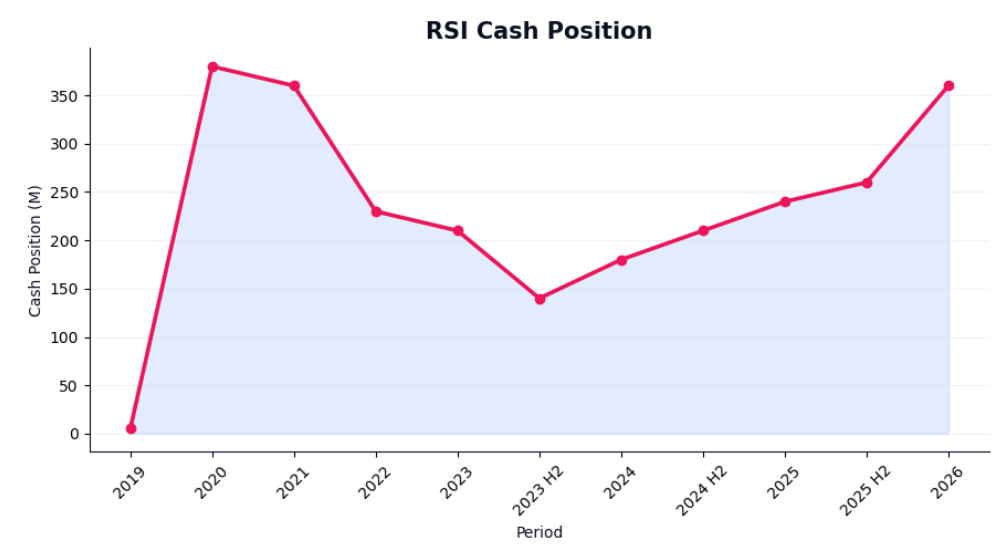
At the same time, the dilution risk is partly offset by the company’s cash position. RSI’s data shows net cash per share of $5.68, estimated cash of $576.94 million, and quarterly burn of $20.11 million. These figures confirm that RSI is not under immediate financing pressure. The cash need indicator is marked as low, which is consistent with the idea that the company has enough liquidity to reduce the near-term probability of raising capital through additional equity issuance.
The cash position chart shows a sharp increase around 2020, followed by a multi-year decline and then a recovery into the most recent period. This pattern shows that RSI’s balance sheet has experienced both cash drawdown and cash rebuilding. The decline from the earlier peak indicates that cash has been consumed or redeployed over time, while the recent recovery suggests improved liquidity.
The quarterly burn of $20.11 million is also important. Even with a large estimated cash balance, burn rate must be monitored because persistent cash consumption can gradually change the dilution profile. At the current level shown, the company appears to have enough liquidity to absorb ongoing burn. If burn decreases as revenue scales and margins improve, dilution risk declines further. If burn remains persistent or increases, the company’s future need for capital becomes more relevant.
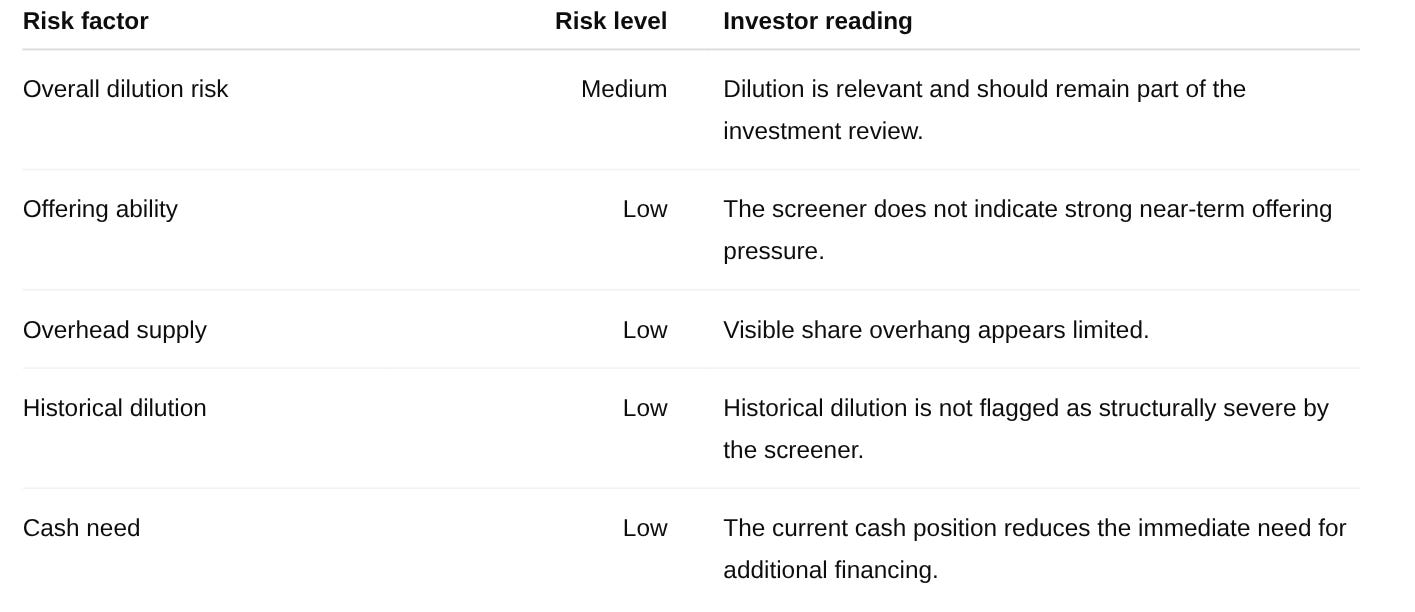
Offering ability is marked low, which indicates that the screener does not currently identify strong near-term offering pressure. Overhead supply is also marked low, suggesting that visible selling pressure from prior issuance or overhang is not considered severe by the screener. Historical dilution is marked low, although this should be interpreted carefully because the chart still shows a meaningful increase in shares outstanding over time.
The institutional ownership figure is also notable. Data shows 98.2% institutional ownership, which implies that RSI’s shareholder base is concentrated among institutions. This can be interpreted in two ways. On one hand, high institutional ownership can indicate that professional investors are involved in the stock. On the other hand, it can also make the stock more sensitive to institutional portfolio adjustments, block sales, or changes in sentiment. When institutional ownership is this high, investors should monitor ownership changes, insider activity, secondary offerings, and large holder transactions.
Short interest is shown at 9.2%. A short interest level of this size can indicate skepticism or hedging activity, but dilution risk depends more directly on the company’s share issuance behavior, cash burn, capital needs, and financing structure. For RSI, the short interest figure should be viewed as a secondary market signal rather than the main determinant of shareholder risk.
Overall, RSI’s dilution profile is mixed but positive. The company has a rising share count, which creates a real per-share issue. However, the current risk indicators are mostly low, and the cash position reduces immediate financing pressure.
RSI must show that growth translates into better per-share economics. The most relevant confirmation would come from stable or declining share count, improving net income, stronger operating cash flow, lower cash burn, and consistent growth in cash flow per share. If the company continues to grow while limiting new issuance, the dilution risk becomes manageable. If the share count continues to rise faster than profitability and cash generation, shareholder
Income
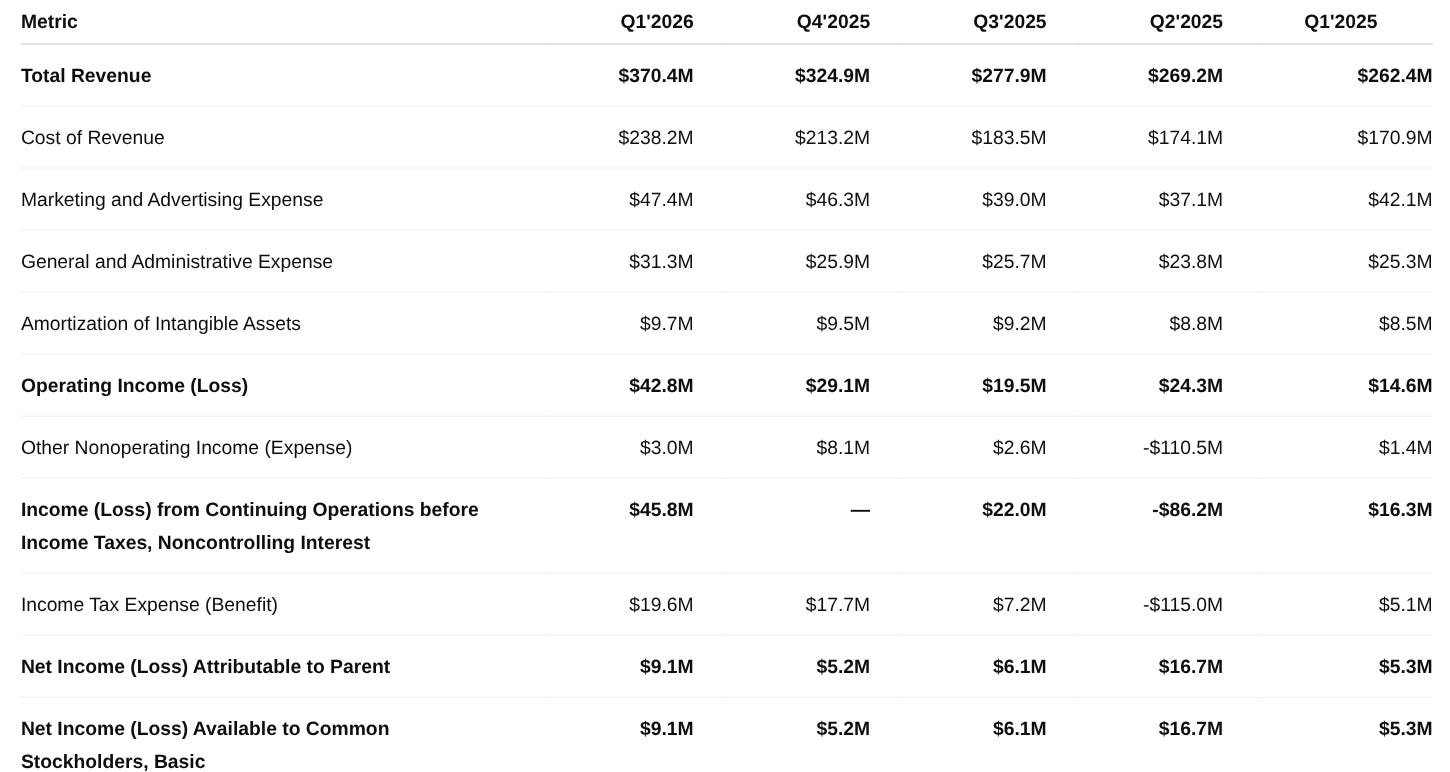
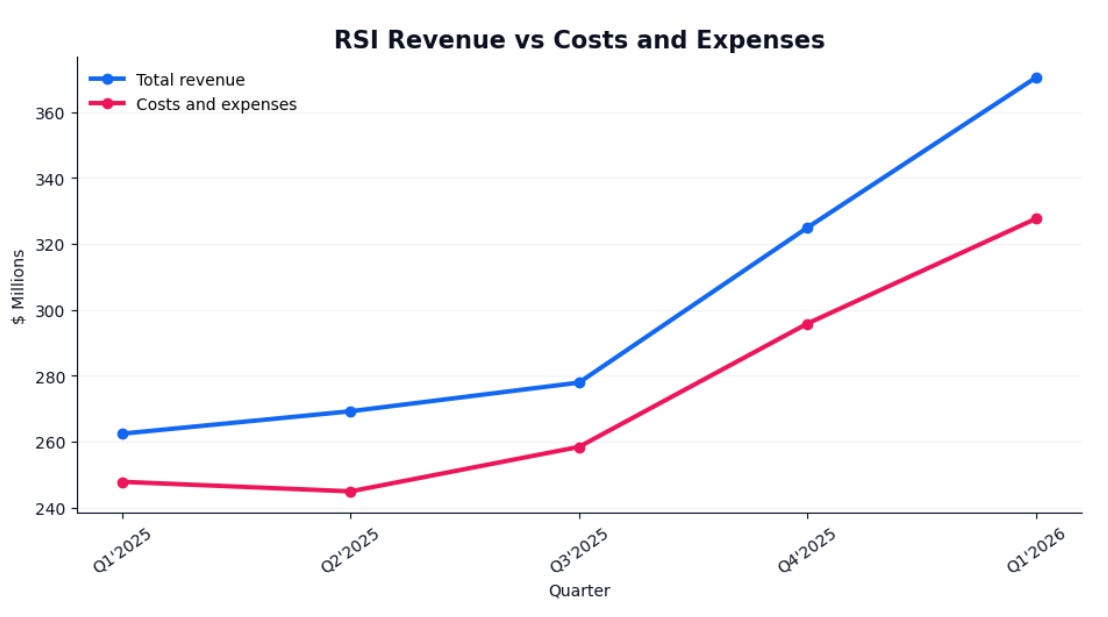
The income statement shows a company with strong top-line growth and improving operating leverage. Total revenue increased from $262.4M in Q1 2025 to $370.4M in Q1 2026, representing approximately 41% year-over-year growth. Sequentially, revenue also increased from $324.9M in Q4 2025 to $370.4M in Q1 2026, showing that the company continued to expand beyond the previous quarter.
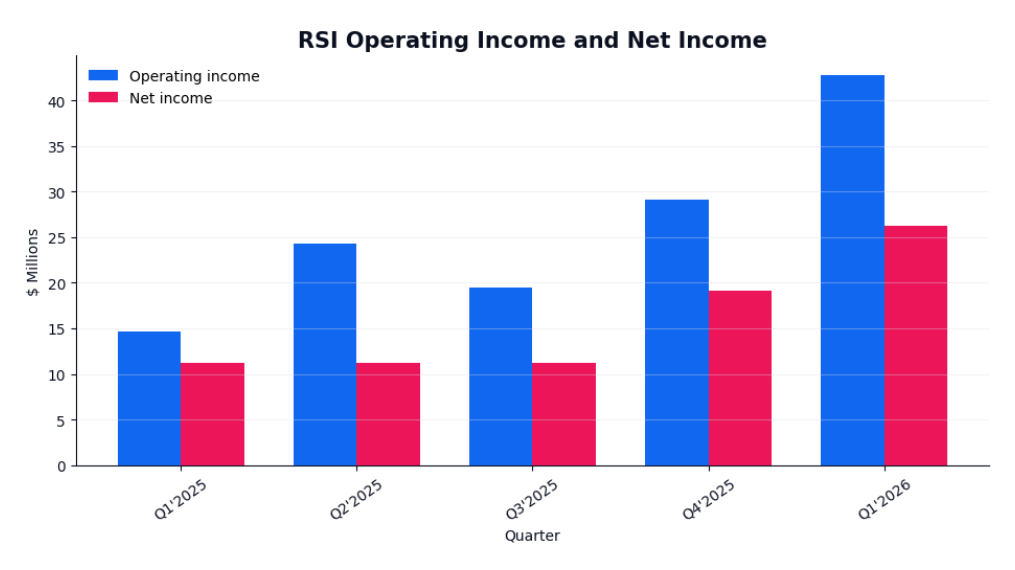
Operating income also improved significantly. RSI generated $42.8M in Q1 2026, compared with $14.6M in Q1 2025. That represents an increase of almost 193% year over year. This is a positive signal because operating income grew much faster than revenue, which indicates that the company is gaining operating leverage. Basically, RSI is converting a larger portion of its revenue into operating profit.
Cost of revenue increased from $170.9M in Q1 2025 to $238.2M in Q1 2026. This increase is expected given the higher revenue base, but it grew slightly slower than revenue. As a result, gross profit improved from $91.5M in Q1 2025 to approximately $132.2M in Q1 2026. Gross margin also improved slightly, from around 34.9% to 35.7%. This margin stability is important because it shows that RSI’s revenue growth is not being achieved through a major deterioration in direct profitability.
Marketing and advertising expense is especially important for an online gambling company because customer acquisition is one of the main drivers of both growth and risk. RSI spent $47.4M on marketing and advertising in Q1 2026, compared with $42.1M in Q1 2025. In absolute terms, marketing expense increased. However, as a percentage of revenue, it declined from 16.0% in Q1 2025 to 12.8% in Q1 2026. It indicates that RSI generated more revenue without increasing marketing spend at the same pace. From an investor’s perspective, this suggests improved marketing efficiency and better customer monetization.
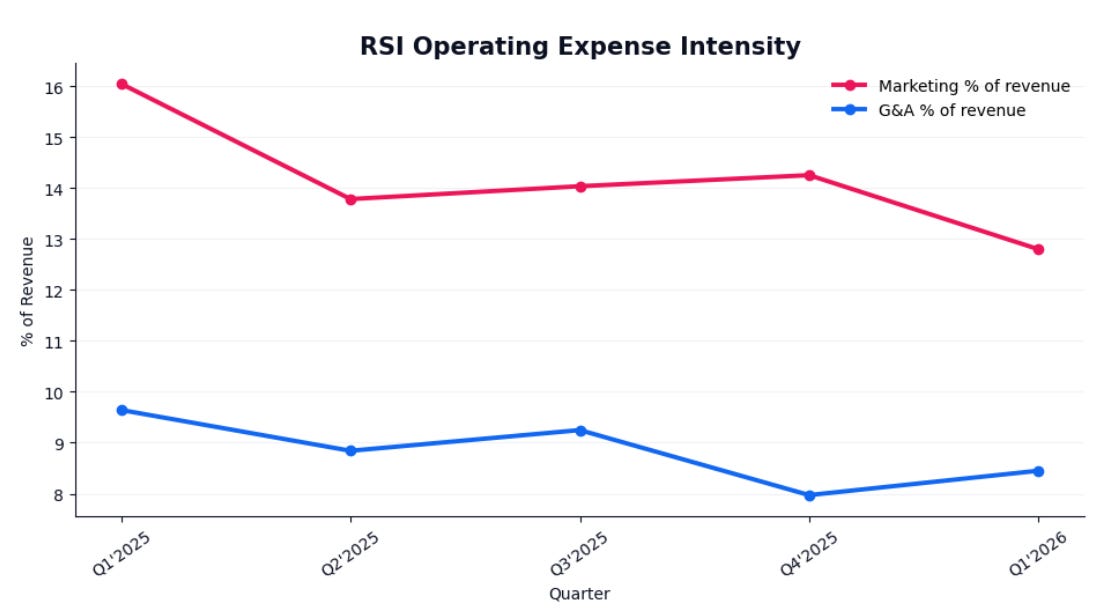
General and administrative expense increased from $25.3M in Q1 2025 to $31.3M in Q1 2026. The increase is material, but it remained controlled relative to revenue growth. As a percentage of revenue, G&A declined from approximately 9.6% to 8.5%. This supports the same operating leverage argument. The company is scaling revenue faster than some of its operating cost categories.
Total costs and expenses increased from $247.8M in Q1 2025 to $327.6M in Q1 2026, an increase of 32%. Since revenue increased by 41%, the income statement shows a favorable spread between revenue growth and expense growth. This spread is what drives the improvement in operating income. This shows that the company’s growth is translating into better profitability.
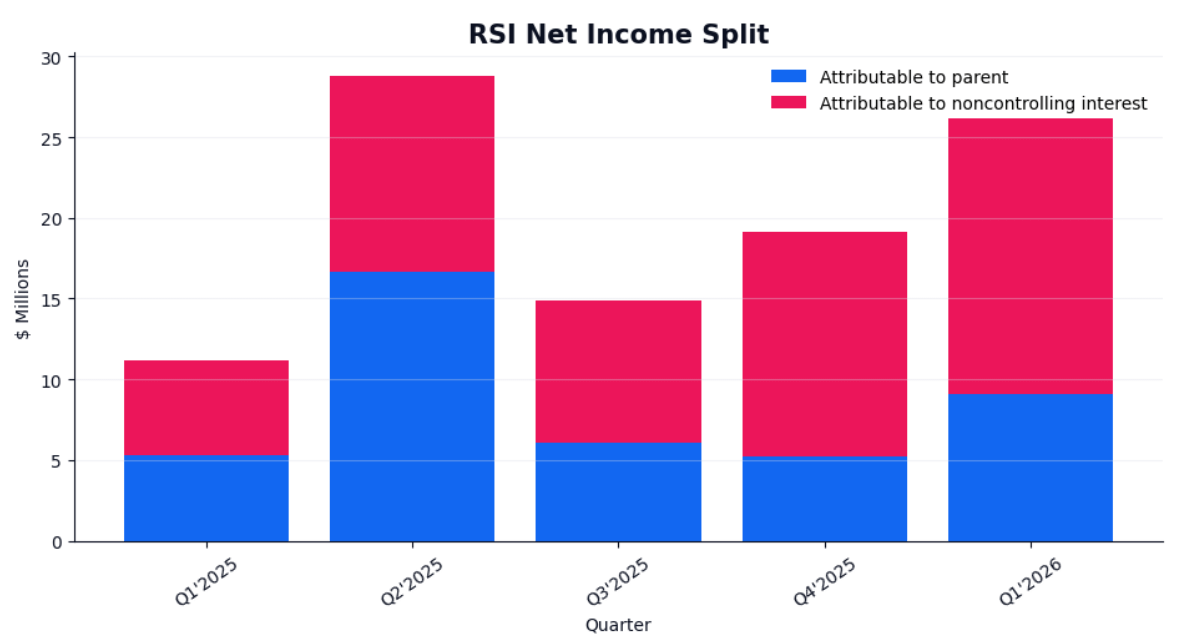
Net income also improved. RSI reported $26.2M of net income in Q1 2026, compared with $11.2M in Q1 2025. That represents growth of 134% year over year. Sequentially, net income increased from $19.1M in Q4 2025 to $26.2M in Q1 2026. This confirms that the improvement is visible also at the bottom line.
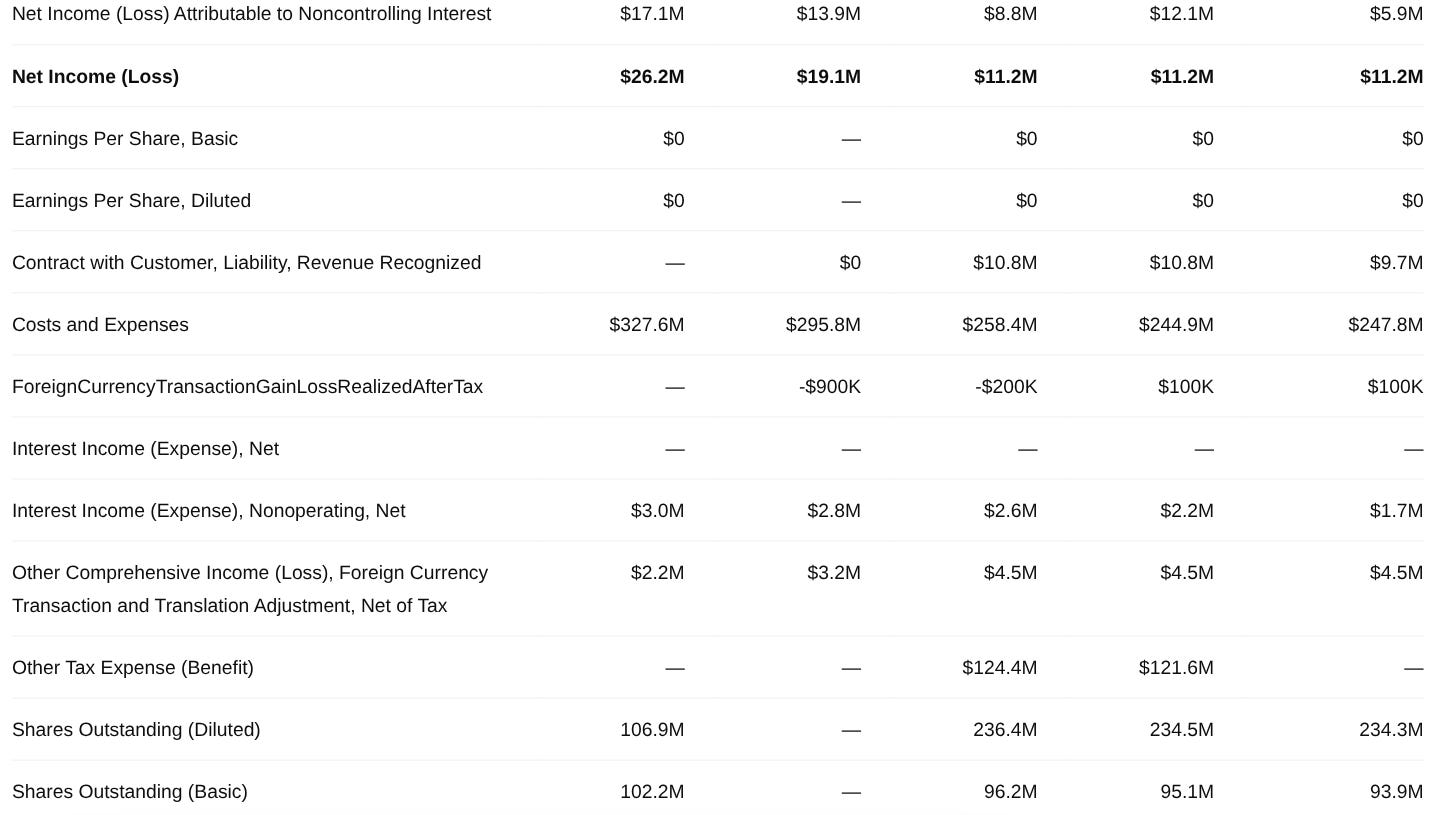
However, the data also shows that not all net income belongs directly to common shareholders. Net income attributable to the parent was $9.1M in Q1 2026, while net income attributable to noncontrolling interest was $17.1M. RSI’s structure means that investors should continue separating consolidated net income from income available to common shareholders.
The Q2 2025 column contains unusual items that distort comparability. Other nonoperating income was negative $110.5M, while income tax expense showed a benefit of $115.0M. These two large items heavily affected pre-tax income and tax expense, making Q2 2025 less useful as a clean operating comparison. For that reason, Q1 2026 should be compared more directly with Q1 2025, Q3 2025, and Q4 2025 when analyzing recurring income statement performance.
Earnings per share is shown as $0 across the quarters. This means EPS is not very informative, likely because of rounding, share structure, or the relationship between consolidated income and income attributable to common stockholders.
Basic shares outstanding increased from 93.9M in Q1 2025 to 102.2M in Q1 2026, an increase of approximately 8.8%. This is relevant because the company’s profitability improved, but shareholders also experienced dilution. The key investor question is whether earnings and cash flow are growing faster than the share count. In Q1 2026, profit growth exceeded share count growth, but the share count still needs to be monitored.
Overall, RSI’s income statement shows a stronger operating profile than the prior year. Revenue growth is strong, operating income is expanding faster than revenue, marketing expense is becoming more efficient as a percentage of sales, and net income is improving. The main investor watchpoints are the split between consolidated net income and income attributable to common shareholders, the unusual nonoperating and tax effects in Q2 2025, and the continued increase in basic shares outstanding.
Balance
RSI’s balance sheet shows a company whose asset base has expanded over the period shown. Total assets increased from $314.8M in Q3 2023 to $677.3M in Q1 2026. This is a material increase and indicates that the company has built a larger financial base over the last several quarters. The increase is visible from Q1 2025 onward, when total assets moved from $387.0M to $543.0M in Q2 2025, $593.2M in Q3 2025, and $677.3M in Q1 2026.
The growth in total assets is supported by the increase in current assets and cash. Current assets rose from $223.4M in Q3 2023 to $415.2M in Q1 2026. Cash and cash equivalents increased from $171.2M to $330.6M over the same period. This is one of the strongest elements in the balance sheet because cash represents a liquid resource that can support operations, absorb volatility, and reduce the need for external financing.
The short-term balance sheet position also looks stronger over time. Current assets consistently exceed current liabilities. In Q1 2026, current assets were $415.2M, while current liabilities were $212.0M. This produces a current ratio of approximately 1.96x, which indicates that RSI has almost two dollars of current assets for every dollar of current liabilities. This is a liquidity signal because it shows that the company has enough short-term assets to cover its short-term obligations.
Total liabilities also increased, rising from $152.5M in Q3 2023 to $358.7M in Q1 2026. This increase should be monitored because liabilities expanded alongside the asset base. However, the balance sheet does not show a simple deterioration, because equity also increased. Total stockholders’ equity including noncontrolling interest rose from $162.3M in Q3 2023 to $318.6M in Q1 2026.
The composition of equity is important. Stockholders’ equity attributable to the parent increased from $51.5M in Q3 2023 to $159.1M in Q1 2026. Equity attributable to noncontrolling interest also increased, moving from $110.8M to $159.4M. For common shareholders, the parent-level equity figure is more relevant than total equity including noncontrolling interest. RSI’s parent stockholders’ equity has improved, but investors should continue separating parent equity from noncontrolling interest when assessing book value and shareholder value.
The retained earnings line shows an improving accumulated deficit. Retained earnings were -$136.6M in Q3 2023 and improved to -$93.6M in Q1 2026. This remains negative, which means the company still carries an accumulated deficit, but the trend is improving.
Additional paid-in capital increased from $188.8M in Q3 2023 to $250.4M in Q1 2026. This indicates that the capital base has expanded over time. This connects directly with the dilution analysis, an increase in paid-in capital can reflect equity issuance, stock-based compensation, or other capital transactions.
Accounts payable and accrued liabilities also increased. Accounts payable rose from $23.1M in Q3 2023 to $42.7M in Q1 2026, while accrued liabilities increased from $56.3M to $81.0M. This is consistent with a larger operating base. The key question is whether these liabilities grow in line with revenue and operating activity, or whether they indicate increasing pressure on the company’s working capital.
Overall, RSI’s balance sheet shows a stronger liquidity position, a larger asset base, and improving equity. The most positive elements are the growth in cash, the increase in current assets, the improvement in parent stockholders’ equity, and the reduction in accumulated deficit. The main watchpoints are the increase in total liabilities, the large role of noncontrolling interest within total equity, and the continued expansion in additional paid-in capital.
Cash flow
RSI’s cash flow statement shows a company that has generated positive operating cash flow across every visible quarter. Net cash provided by operating activities was $20.1M in Q1 2026, $69.1M in Q4 2025, $95.8M in Q3 2025, $54.8M in Q2 2025, and $28.7M in Q1 2025. The company also generated strong operating cash flow in the earlier visible quarters, with $81.1M in Q2 2024 and $80.6M in Q3 2024. This indicates that RSI’s operating model has produced recurring cash inflows, even though the quarterly pattern is volatile.
The comparison between net income and operating cash flow is especially relevant. Net income improved from -$2.2M in Q2 2024 to $26.2M in Q1 2026, while operating cash flow remained positive throughout the full period. In several quarters, operating cash flow was much higher than net income. This reflects the impact of noncash expenses, working-capital movements, and other cash flow adjustments. This is a positive signal because the business is producing operating cash.
The cash flow by activity shows a clear structure, operating cash flow is positive, while investing and financing cash flows are generally negative. Investing cash flow was negative in every visible quarter, including -$9.2M in Q1 2026, -$8.1M in Q4 2025, and -$28.8M in Q3 2025. The negative investing cash flow is linked to software development, intangible assets, and other investment activity.
Financing cash flow was also negative in every visible quarter. The most notable outflows were -$34.4M in Q3 2025, -$33.9M in Q2 2025, -$27.2M in Q1 2025, and -$22.7M in Q1 2026. A major component of these financing outflows is tax withholding related to share-based payment arrangements. Share-based compensation can affect both the income statement and the share count, while tax withholding related to stock awards creates real cash outflows.
The period cash change including foreign exchange effects was positive in most visible quarters, but it turned negative in Q1 2026, with a decrease of -$3.8M. It shows that operating cash generation was not enough to fully offset investing and financing outflows in that quarter. By contrast, Q4 2025 showed a strong positive cash increase of $63.0M, supported by $69.1M of operating cash flow and relatively limited investing and financing outflows.
The noncash adjustment lines are important because they explain part of the gap between net income and operating cash flow. Depreciation, depletion, and amortization increased from $7.6M in Q2 2024 to $12.7M in Q1 2026. Share-based payment noncash expense was more volatile, with high values such as $26.6M in Q3 2024, $23.8M in Q3 2025, and $8.7M in Q1 2026.
The investing section shows that RSI continues to spend on software and intangible assets. Payments to develop software were $8.6M in Q1 2026, $7.0M in Q4 2025, and $21.8M in Q3 2025. For a digital gambling company, technology investment can be productive if it improves platform reliability, customer retention, product depth, and operating scalability.
The company is funding investing activity and financing-related outflows from operations in most quarters. However, the quality of cash flow needs to be assessed because operating cash flow is influenced by noncash adjustments, share-based compensation, working-capital movements, and tax items.
Ratios
RSI’s ratios show a company with improving profitability, strong liquidity, no visible balance-sheet debt pressure, and positive cash-flow generation. The ratio table is useful because it connects the income statement, balance sheet, and cash flow statement into a single analytical view. Instead of looking only at revenue growth or net income, the ratios show whether RSI is becoming more profitable, more liquid, less levered, and more cash-generative on a relative basis.
Operating margin increased from 1.90% in Q2 2024 to 11.55% in Q1 2026. It shows that RSI is converting more revenue into operating income over time. The path is not perfectly linear, but the overall direction is positive. The increase from 5.56% in Q1 2025 to 11.55% in Q1 2026 is important because it shows year-over-year margin expansion.
Net margin also improved compared with the earlier periods, although it remains much lower than operating margin. Net margin moved from -0.05% in Q2 2024 to 2.45% in Q1 2026. The data also shows a temporary peak of 6.20% in Q2 2025. The more relevant point is that RSI has moved from near-breakeven or slightly negative net margin into positive net margin. This indicates that profitability is improving, but the gap between operating margin and net margin still matters for common shareholders.
Return metrics also show progress. ROE was 5.70% in Q1 2026, compared with -0.16% in Q2 2024 and 1.71% in Q3 2024. ROA was 1.34% in Q1 2026, compared with -0.03% in Q2 2024 and 0.33% in Q3 2024. RSI is generating positive returns on both equity and assets, which supports the idea that the business is becoming more productive. The Q2 2025 ROE of 13.57% and ROA of 3.07% stand out, but that quarter should be treated cautiously because it appears influenced by unusual items.
The current ratio increased from 1.62 in Q3 2023 to 1.96 in Q1 2026. The quick ratio is the same as the current ratio across the data, which indicates that liquid or near-liquid current assets represent most of the current asset base. The cash ratio also improved from 1.24 in Q3 2023 to 1.56 in Q1 2026. This is a positive liquidity signal because cash alone covers a large portion of current liabilities. RSI’s liquidity profile reduces near-term financing pressure and supports the earlier conclusion that immediate dilution risk is not the main concern.
The leverage section is also favorable. Debt / equity and debt / assets are both shown as 0.00 across the visible periods. This indicates that RSI does not appear to be carrying meaningful balance-sheet debt. The absence of debt pressure is important because it reduces financial risk and gives the company more flexibility.
The equity / assets ratio improved from 16.36% in Q3 2023 to 23.49% in Q1 2026. This means equity represents a larger share of the asset base over time. The improvement is positive because it shows that the company’s capital structure has strengthened. However, this ratio should still be analyzed together with dilution. A rising equity base is good, but investors must also check whether equity growth comes from retained profitability, capital issuance, or stock-based compensation. The strongest version of the investment case occurs when equity / assets improves because profits and cash flow are building the company’s capital base without excessive share expansion.
RSI generated positive free cash flow in every visible quarter where the metric is reported. Free cash flow was $19.9M in Q1 2026, $68.9M in Q4 2025, $95.3M in Q3 2025, $54.1M in Q2 2025, and $28.6M in Q1 2025. This shows that RSI is generating cash after capital expenditures and investment requirements. The company’s free cash flow profile supports the balance sheet and reduces dependence on external financing.
FCF margin is positive but volatile. It was 5.36% in Q1 2026, down from 21.21% in Q4 2025 and 34.30% in Q3 2025. The decline in Q1 2026 does not eliminate the positive cash-flow profile, but it does show that cash conversion can fluctuate significantly from quarter to quarter. For investors, the key question is whether RSI can sustain positive free cash flow margins over a full year rather than only in isolated quarters.
RSI reported OCF / net income of 2.22x in Q1 2026, 13.17x in Q4 2025, and 15.84x in Q3 2025. These values show that operating cash flow has generally exceeded net income. That is positive because it indicates strong cash conversion.
The main watchpoints are the volatility of net margin, the unusual return metrics in Q2 2025, the decline in FCF margin in Q1 2026, and the need to separate true per-share value creation from accounting improvements. The ratios show a company moving in the right direction, but the final investor judgment depends on whether these improvements remain durable across future quarters.
The most important focus going forward is sustainability. RSI becomes more attractive if operating margins stay above prior levels, free cash flow remains positive, and equity growth translates into better per-share value.
Segment
RSI’s segment data shows a company whose revenue base is highly concentrated in online casino and online sports betting. Total revenue increased from $691.2M in FY2023 to $924.1M in FY2024 and $1.13B in FY2025. This represents a clear multi-year expansion in the company’s revenue base. The growth profile is important because it confirms that RSI is improving quarter by quarter, and also scaling on a full-year basis.
Online casino and online sports betting generated $674.1M in FY2023, $917.1M in FY2024, and $1.13B in FY2025. This segment accounts for almost all company revenue in every visible year. This confirms that RSI’s economic value is tied primarily to the performance of its digital wagering platform, not to retail betting or social gaming.
Retail sports betting is a very small part of the revenue base and has declined. Retail sports betting revenue decreased from $12.8M in FY2023 to $2.4M in FY2024 and $2.0M in FY2025. This decline confirms that RSI’s business mix has become even more digital. This is relevant because the company’s future performance should be analyzed through online customer acquisition, online casino engagement, sportsbook activity, retention, and platform economics rather than physical retail betting exposure.
Social gaming is also small but stable. Revenue increased from $4.3M in FY2023 to $4.6M in FY2024 and $4.9M in FY2025. The important point is that neither retail sports betting nor social gaming drives the investment thesis. RSI’s business is structurally dependent on online casino and online sports betting.
The geographic breakdown shows that the United States and Canada remain the core revenue region. Revenue from the United States and Canada increased from $611.9M in FY2023 to $785.3M in FY2024 and $979.6M in FY2025. This region represents the majority of total revenue and remains the primary engine of the business. For investors, this means RSI’s performance depends on the North American online gambling market, including regulation, market access, customer acquisition costs, promotional intensity, and competitive pressure.
Latin America and Mexico also increased, from $79.3M in FY2023 to $138.8M in FY2024 and $154.9M in FY2025. This region is smaller than the United States and Canada, but it provides an additional growth channel. Its growth rate from FY2023 to FY2024 was strong, while FY2025 growth was more moderate. From an investor’s perspective, this region adds diversification, but it does not yet change the company’s dependence on the United States and Canada.
The geographic revenue share confirms this concentration. The United States and Canada represented approximately 88.5% of revenue in FY2023, 85.0% in FY2024, and 86.7% in FY2025. Latin America and Mexico represented approximately 11.5%, 15.0%, and 13.7% over the same years. This means RSI remains a North America-led business with a smaller but meaningful Latin America and Mexico contribution. The geographic mix is not overly diversified, but it is not single-region either.
RSI is a digital-first gambling company, and its revenue growth is being driven almost entirely by online casino and online sports betting. The company’s smaller product segments are not material enough to change the investment thesis.
We conclude the review by noting that the next visible catalyst is the upcoming Earnings & Revenue event, with an estimated date around August 5, 2026. The market estimate is EPS of 0.148 and revenue of $362.44M. This event can become an important confirmation point for the investment case. If RSI reports revenue above expectations, maintains operating leverage, and shows continued cash generation, the market can receive another positive signal. If the company disappoints on revenue, margins, or guidance, the stock can become vulnerable because the price already reflects strong expectations.


