[QUANT LECTURES] Strategy evaluation & statistical validation (PART I)
Statistics for algorithmic traders
IMPORTANT
*Again, this chapter is dense and practical, so it’s presented in multiple parts.
**The notebook with the code will be updated once the whole chapter is finnished.
Strategy evaluation & statistical validation
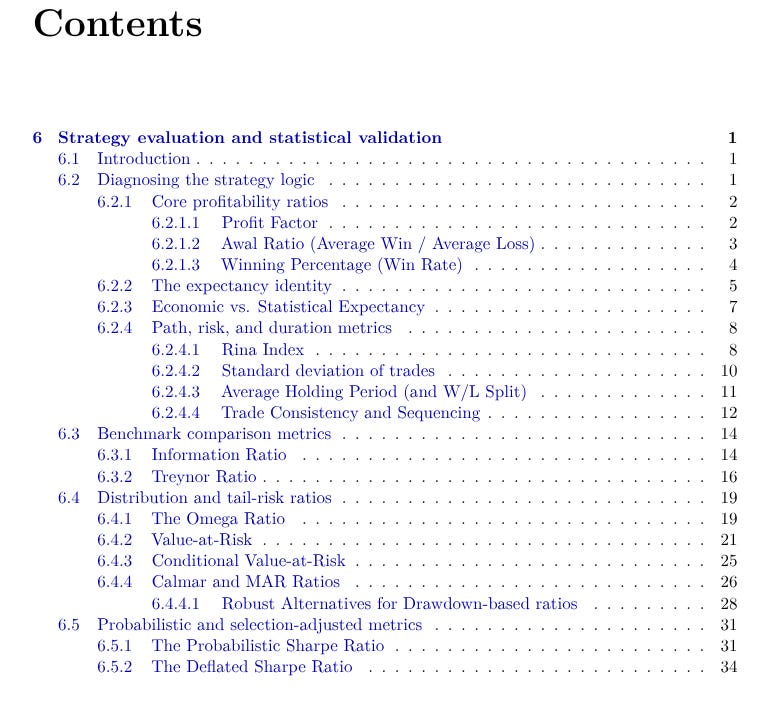
This chapter turns performance measurement into a falsification tool. Instead of staring at a single Sharpe Ratio, you’ll dissect the engine of a strategy: trade-by-trade behaviour, path dependency, benchmark-relative risk, tail losses, and the probability that an apparent edge survives both non-normal returns and selection bias. The workflow runs from simple trade-level ratios to benchmark metrics, tail-risk and drawdown ratios, and finally probabilistic tests like PSR and DSR that “charge” you for every backtest you’ve ever run.
What’s inside:
Event-based diagnostics. Open the black box of trades: move from smoothed portfolio returns to the discrete sequence of wins and losses that actually generates P&L, and use this to check whether the data matches your narrative about the strategy.
Core profitability ratios. Use Profit Factor, Awal Ratio (Average Win / Average Loss), and Win Rate to characterise the payoff profile—high-probability nickel-picking vs. low-hit-rate trend following—and to see whether total gains truly dominate total losses.
Expectancy engine. Build the expectancy identity linking Win%, Avg Win and Avg Loss; compute per-trade expectancy and the implied break-even win rate so you can tell whether a broken system needs better signals, better payoffs, or both.
Economic vs. statistical expectancy. Translate statistical edge into economic edge by subtracting commissions, fees and slippage—showing when a “significant” backtest is still worthless once real-world frictions are included.
Path, risk & duration profile. Connect the trade engine to the equity curve via Rina Index, trade-level volatility, holding periods for winners vs. losers, streak lengths and time-under-water—metrics that capture both variance drag and psychological pain.
Benchmark comparison metrics. Evaluate performance in context using the Information Ratio (alpha per unit of tracking error) and Treynor Ratio (excess return per unit of beta) to judge whether a strategy deserves capital next to simple benchmark exposure.
Distribution- and tail-risk ratios. Go beyond volatility with the Omega Ratio, Value-at-Risk, Conditional VaR, and Calmar/MAR ratios, including coherent CVaR-based alternatives and bootstrap CIs that separate genuine tail risk from one-path anecdotes.
Probabilistic Sharpe Ratio (PSR). Replace “Sharpe = 1.4” with “There’s a X% probability the true Sharpe exceeds SR*,” using skewness and kurtosis-adjusted standard errors to penalise negative skew and fat tails.
Deflated Sharpe Ratio (DSR). Pay a statistical price for data mining: estimate the Sharpe you’d get from the luckiest of N random trials and use it as the hurdle inside PSR, yielding the probability that your best backtest survives multiple-testing and selection bias.


