[Quant Lecture] Statistical test for trading systems
Statistics for algorithmic traders
Statistical Tests for Trading Systems
This chapter turns strategy evaluation into a decision process: a toolkit that separates repeatable edge from noise and diagnoses how a strategy makes money, how much risk it takes, and which market dependencies it exploits. It moves beyond eyeballing equity curves to falsifiable tests with clear hypotheses and interpretable outcomes.
What’s inside:
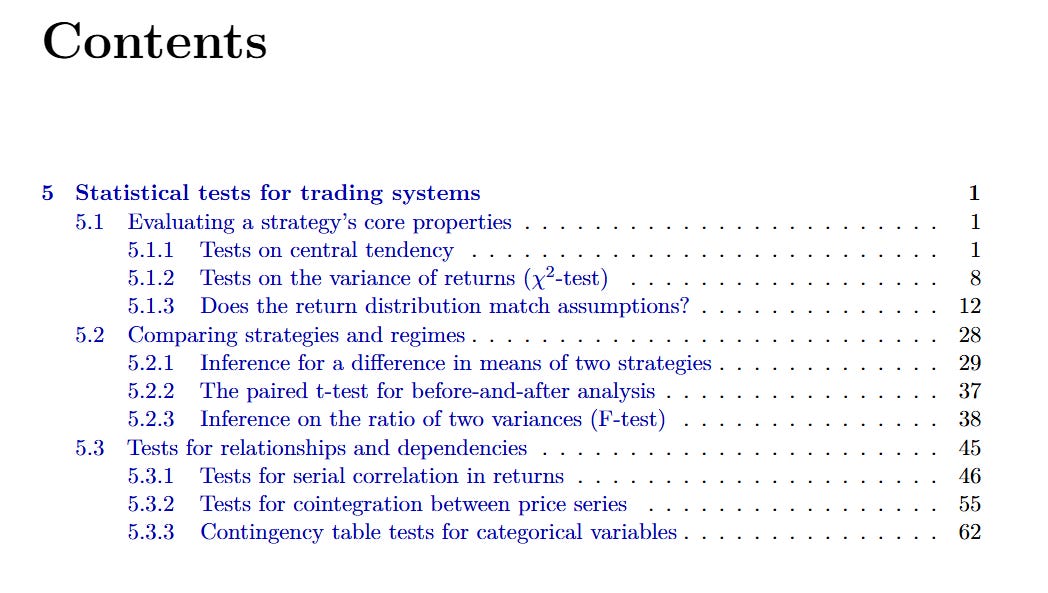
Profitability & consistency (central tendency). Robust t-tests for mean return alongside the Wilcoxon Signed-Rank to detect period-by-period consistency vs. outlier-driven gains—yielding diagnostic profiles like “lottery ticket,” “insurance seller,” “gold standard,” or “no edge.”
Risk targeting (single-variance χ² test). A formal check that realized variance meets a risk cap/target—and why normal-return assumptions make the classic χ² fragile under fat tails.
Distributional fit (GoF). K–S, Lilliefors, and χ² GoF tests to validate return-distribution assumptions; pros/cons including tail sensitivity and binning pitfalls.
Comparing strategies/regimes: means. Tests for difference in means across strategies or periods and a paired t-test for before-and-after changes.
Comparing strategies/regimes: variances. F-tests for the ratio of two variances to assess volatility changes across approaches or regimes.
Dependence in returns. Serial-correlation tests to detect trend-following or mean-reversion footprints.
Long-run relations. Cointegration tests to uncover equilibrium links for pairs/spread trading.
Categorical structure. Contingency-table for relationships between discrete states (e.g., regimes, events) and outcomes.
Check a sample of what you will find inside:


