[Quant Lecture] Data types, structures, and preliminary analysis
Statistics for algorithmic traders
Data Types, Structures, and Preliminary Analysis
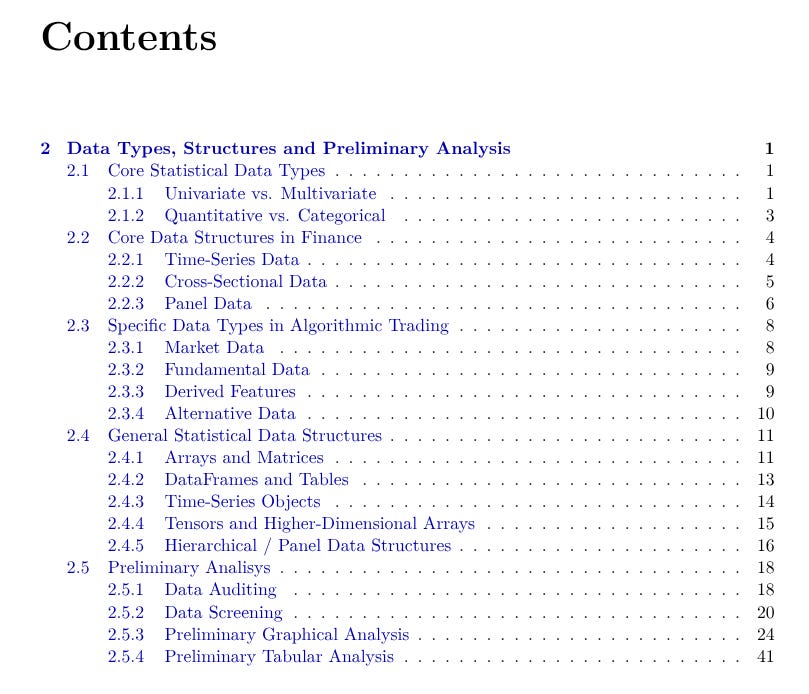
This chapter distinguishes between what is being measured (data types) and how it’s organized in memory (data structures), guiding researchers through a systematic exploration to ensure integrity, prevent hidden biases, and lay the groundwork for robust, reproducible models.
What’s inside:
Core data types and structures: Explore the fundamental classifications of data as either univariate or multivariate and as quantitative or categorical. Learn the three primary data structures in finance: time-series , cross-sectional , and panel data.
Specialized financial data: Discover the specific types of data used in algorithmic trading, from traditional market data (tick and OHLCV) and fundamental data to derived features and modern alternative data sources.
Statistical data organization: Understand the computational structures used to hold and manipulate data for analysis. This includes high-performance arrays and matrices , versatile and context-rich DataFrames , specialized time-series objects , and hierarchical structures for complex panel data.
Data quality and auditing: Treat data as a product of a complex manufacturing process that requires forensic auditing. Learn to establish data governance policies , conduct independent reanalysis to find subtle flaws , and guard against structural data contamination like lookahead bias.
Data screening and preparation: Understand the initial analytical assessment of a dataset's characteristics. This involves investigating data pedigree , using robust summary statistics to find outliers , analyzing patterns of missing data , and addressing multicollinearity between predictor variables.
Graphical and tabular analysis: Employ a continuous visual dialogue with the data using a wide array of plots—from histograms and scatter plots to network graphs—to build intuition and diagnose models. Use the precision of tabular analysis to dissect multidimensional relationships, test for data sparsity, and present results with clarity.
Advanced measurement concepts: Delve into the challenges of using data from complex systems, where the data itself is the output of a model. Understand the role of unobservable latent variables (e.g., "market sentiment") and learn to model different types of measurement error that can bias backtested results.
Check a sample of what you will find inside:


