

[INTEL REPORT] Current geopolitical map of the macroeconomy
Oil routes, rare earths and cloud infrastructure

Table of contents:
Introduction.
Global macro regime after the February rupture.
Trade, tariffs, and the AI capital cycle.
Financial conditions, emerging markets, and the new debt geometry.
Europe between inflation, industry, and rearmament.
Chokepoints, rare earths, and the structure of strategic rivalry.
Audio Note: Before we begin, remember that if you’re accessing this article through the Substack app, you can listen to it instead of reading it. The MarketOps section is best suited for this format.

Before you begin, remember that you have an index with the newsletter content organized by clicking on the image below.

Introduction
The central feature of this moment is that macroeconomics can no longer be separated from geopolitics. Oil routes, LNG flows, shipping insurance, semiconductor supply, rare-earth processing, defence procurement, and AI infrastructure now sit inside the same transmission system. A military clashes can move inflation expectations. A tariff decision can alter capital spending. A mineral export license can affect vehicle production, renewable deployment, and defence readiness. The channels that once belonged to separate policy worlds now reinforce one another.
The AI capital cycle is still creating demand for chips, servers, data centres, power systems, and advanced equipment. Fiscal support and defence spending are cushioning parts of the cycle. Services trade remains more resilient than goods trade. But the composition of growth has changed. Expansion increasingly depends on investment linked to security, technology, energy resilience, and state-backed industrial strategy.
That shift creates a new hierarchy among economies. Countries with energy supply, fiscal space, reserve buffers, advanced industrial capacity, or control over strategic inputs gain room to maneuver. Countries dependent on imported fuel, external financing, weak currencies, or narrow export bases face a tighter constraint. Financial markets are beginning to price that difference. The old distinction between advanced and emerging markets matters less than exposure to chokepoints, debt rollover, energy costs, and industrial depth.
Europe sits at the center of this adjustment because it faces all of these pressures at once. Imported energy inflation, weak industrial momentum, rising defence commitments, and the need to rebuild competitiveness without abandoning decarbonisation, all at the same time. The United States sits in a different position, supported by technology investment and capital inflows but still exposed to inflation persistence and strategic overextension. China retains industrial scale and export strength, while also relying on external demand and commanding key processing stages in critical supply chains.
You can go deeper by reviewing this:

The result is a world economy still moving forward, but no longer under the assumptions that defined the previous era. Efficiency is giving way to resilience. Open access is giving way to managed access. Supply chains are being judged not only by cost, but by survivability. The rest of 2026 will therefore depend less on whether growth exists and more on what kind of growth remains possible when war risk, tariffs, energy security, AI investment, debt pressure, and strategic bottlenecks all operate at the same time.

Global macro regime after the February rupture
The macro setting in April carries a dual character with unusual clarity. Growth continues, yet the safety margin around that growth has narrowed. Productive capacity still expands, yet the cost of keeping that expansion on course has risen. The world economy entered the year with stronger momentum than many institutions had expected in late 2025, then moved into a new phase when the Middle East conflict. That event arrived while the international trade system was still adjusting to the earlier shift in United States trade policy, which means the present environment combines war risk, tariff uncertainty, supply-chain rewiring, and a tighter premium on energy security inside a single macro regime. The result!? The economy still moves forward…
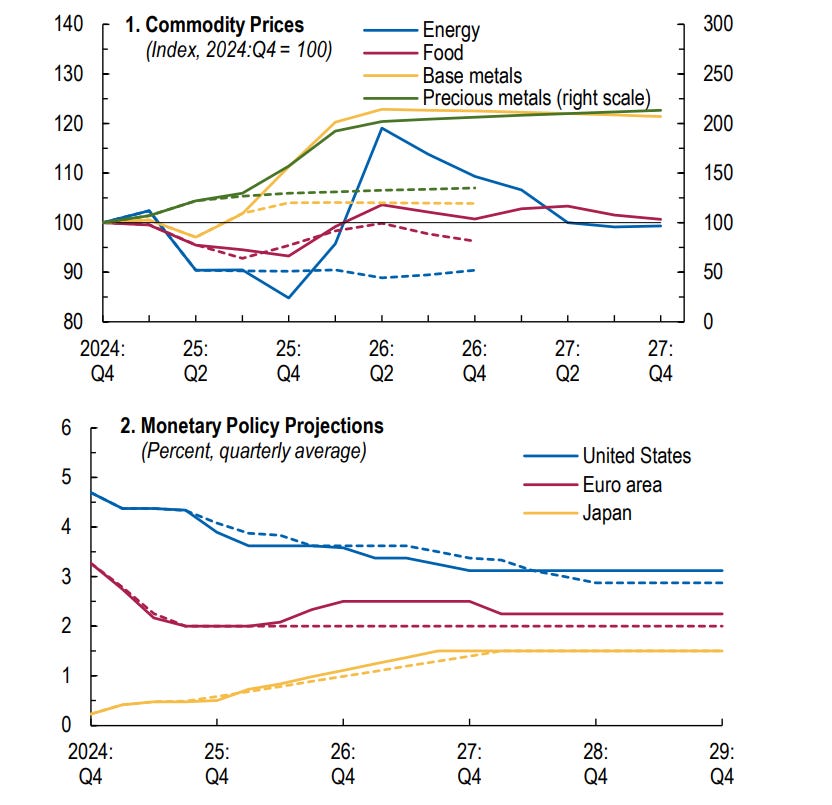
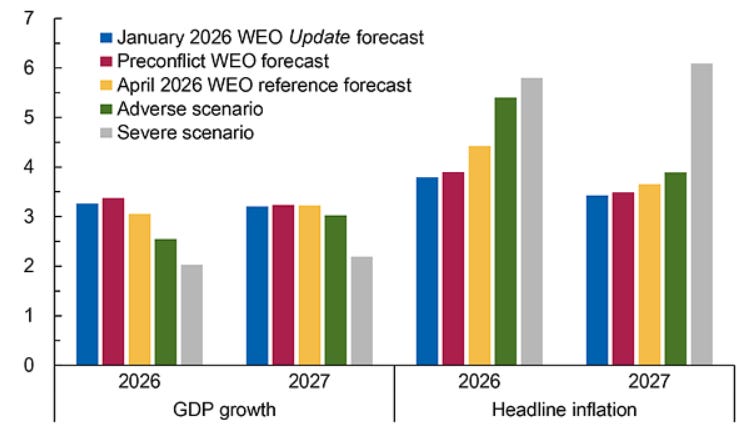
Even under that path, the global outlook loses altitude. World growth is projected at 3.1 percent in 2026 and 3.2 percent in 2027, while global headline inflation rises to 4.4 percent in 2026 before easing to 3.7 percent in 2027. It confirms continued global expansion, yet it also confirms a return of the energy channel as a first-order driver of inflation, monetary timing, household purchasing power, and corporate margins. The downside scenarios reinforce the message. In the adverse case, growth falls to 2.5 percent and inflation rises to 5.4 percent in 2026. In the severe case, growth falls to 2 percent in both 2026 and 2027 while inflation rises above 6 percent. That spread between the reference path and the tail scenarios defines the new regime.
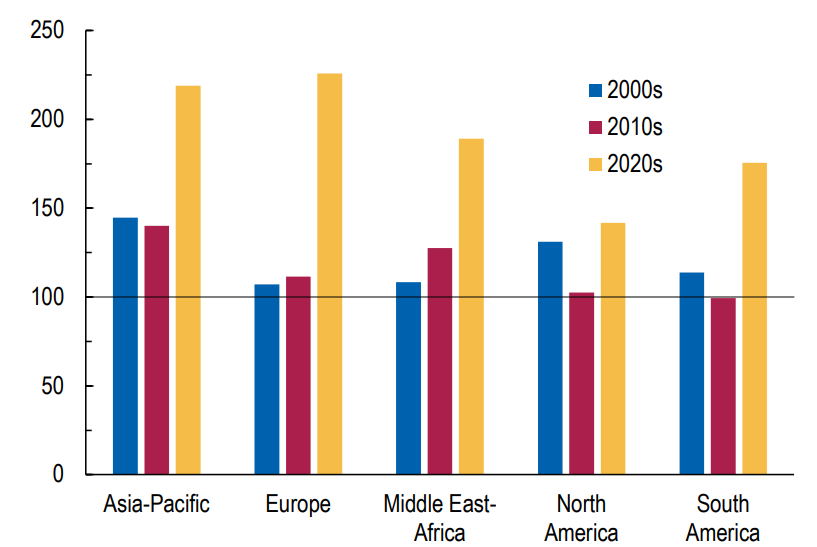
This chart gives the best opening frame for this because it shows that the February rupture belongs to a longer rise in geopolitical tension across regions. The 2020s stand above the 2000s and 2010s in every major region shown. The Middle East and Africa carry the highest level, which fits the immediate conflict geography. Europe and Asia-Pacific also register a clear step-up, which speaks to the wider strategic setting that already included the war in Ukraine, technology rivalry, sanctions, and maritime frictions before the latest shock. North America and South America show a lower level than the conflict core, yet they also sit above earlier decades.
That structural shift affects the transmission channels because it moves through the entire macro system. There are three central channels. The first is the direct commodity-price shock, which raises energy and input costs, disrupts transport, and weakens real incomes. The second is the expectations channel, where firms and workers seek to recover losses and thereby give price persistence a stronger foothold. The third is the financial channel, where higher risk premia, weaker asset valuations, tighter credit conditions, and capital outflows reduce demand and complicate policy. These channels reinforce one another. Oil and gas feed into fertilizer, freight, aviation fuel, and industrial inputs. Higher shipping and insurance costs pass into goods prices. Exchange-rate depreciation amplifies imported inflation, especially in commodity-importing emerging economies. In that setting, macroeconomics and statecraft operate in one field of transmission. Growth, inflation, shipping security, energy access, sanctions, and industrial policy act together.
The regional pattern adds another layer of meaning because the large macro blocs entered this point with different structures. The activity in China and the United States had been stronger than expected, yet that strength carried an uneven internal composition. In China, exports ran ahead while domestic activity, especially housing, remained softer. In the United States, strong activity coincided with low employment growth and slower labor-force expansion. At the same time, the trade regime itself remained in motion. United States statutory tariff rate stood about 5.3 percentage points below the level assumed after court rulings and executive actions, while other countries advanced trade negotiations and new partnerships of their own.
The United States enters this year with firmer demand conditions than most advanced peers and with a continuing technology-investment wave that still supports capital spending. AI-related technology investment added about 0.5 percentage point to US GDP growth, with sizeable spillovers into Asia through import demand for equipment and components. At the same time, inflation pressure in the United States remains higher than expected. Core personal consumption expenditure inflation at 3.1 percent year over year, and the wider WEO discussion presents a path in which US core inflation returns to target during 2027 rather than through an immediate or automatic easing sequence. In the case of China, export performance and industrial scale still carry the expansion. China is projected to grow 4.4 percent in 2026 and 4.0 percent in 2027, with external demand and some fiscal support offsetting a weaker domestic side where consumption remains soft. The euro area enters the year with modest growth and a higher sensitivity to imported energy and industrial input costs. The WEO places euro area growth at 1.2 percent in 2026 and 1.5 percent in 2027, while the euro area headline inflation rises above 2 percent in 2026 and remains above target in 2027.
In the United States, the issue centers on second-round price pressure because domestic demand has held up and inflation remains elevated. In the euro area, the issue centers on imported-price exposure because energy and other tradable inputs still form a key external channel into headline inflation. In China, the policy mix carries a different balance in which low inflation, export competitiveness, the exchange rate, and fiscal support weigh more heavily than overheating fears. The IMF press briefing therefore recommends patience from central banks under the reference case, together with clear communication and readiness to act if inflation expectations shift. On the fiscal side, the Fund emphasizes targeted and temporary support over broad subsidies or price caps, since public debt burdens have already reduced fiscal room.
The world economy still retains pillars of support, and these pillars explain why the baseline remains one of slower expansion rather than a broad contraction. The first pillar is the AI capital cycle. Technology investment remains a real source of demand for semiconductors, network equipment, power systems, and digital infrastructure, while the import intensity of that wave supports trade and investment spillovers across Asia. The second pillar is fiscal support. Fiscal support in various economies and the role of public spending in cushioning economic activity. The third pillar is adaptation through trade and inventories. Global trade remained robust because technology-related exports offset slower momentum in other product categories, and the IMF expects world trade volume growth to slow from 5.1 percent in 2025 to 2.8 percent in 2026 before improving to 3.8 percent in 2027. Goods trade faces a steeper deceleration, while services trade shows greater resilience. That distinction favors economies with stronger positions in digital, financial, and business services and gives the global system a partial buffer against fragmentation in goods.
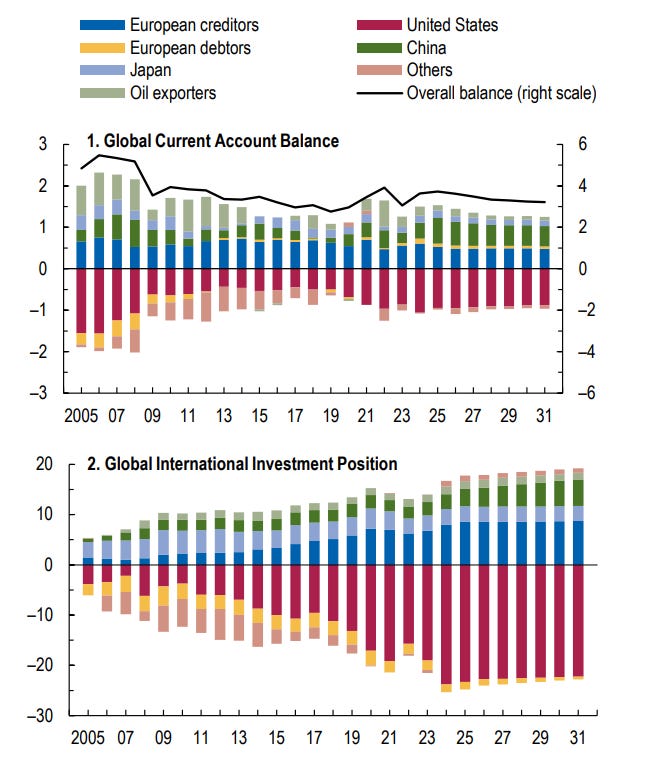
This other chart deepens the argument because it shows that the present shock lands on an international system already shaped by long-running external asymmetries. Global imbalances may decline only modestly over the medium term. Some cyclical narrowing comes from expansionary fiscal packages in surplus economies, yet that narrowing faces countervailing forces. A technology-driven investment surge continues to attract capital toward the United States, and is expected stronger US productivity and high returns in technology-related sectors to keep capital inflows elevated. The same idea states that positive wealth effects and sustained inflows keep the US current account deficit wider than the level seen during the decade before the pandemic. At the same time, China’s continued reliance on export-led growth, together with limited rebalancing toward domestic consumption, sustains another major source of external imbalance.
That is important for geopolitics due to external imbalances influence power, and vulnerability. Current-account surpluses provide room for reserve accumulation, outward finance, and shock absorption. Large debtor positions sharpen sensitivity to financing conditions and exchange-rate moves. In the presence of higher geopolitical risk, those balance-sheet realities shape coalition behavior, sanctions exposure, reserve management, and the capacity to absorb commodity shocks.
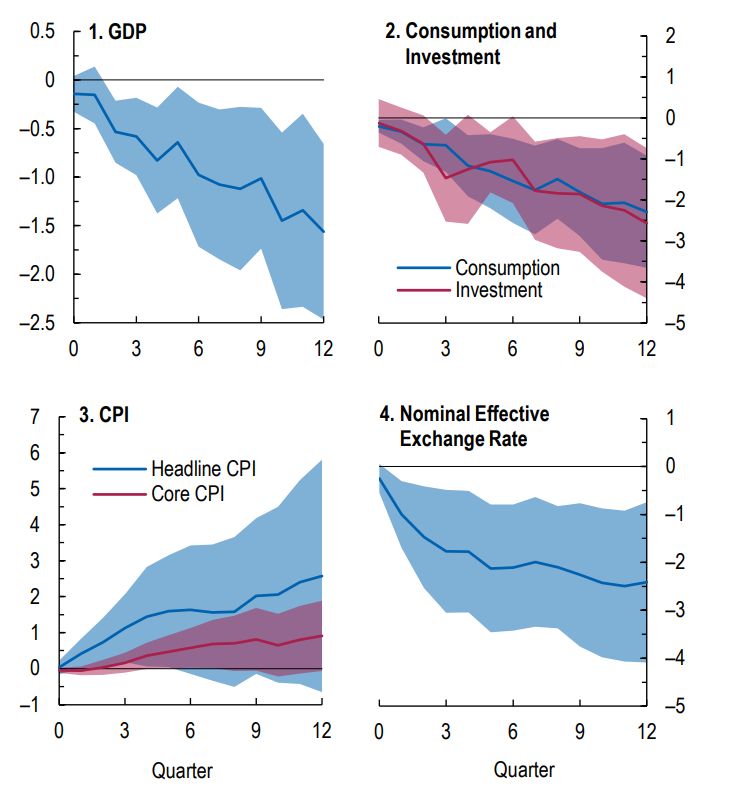
Here the estimation is one-standard-deviation. Geopolitical risk leads to a decline in real GDP of about 0.8 percent one year after the initial shock. The main channels run through weaker private consumption and weaker investment, while consumer prices rise and the nominal effective exchange rate falls. Besides average geopolitical risk in Europe rose by about 1.2 standard deviations after Russia’s invasion of Ukraine and remained elevated at about 0.5 standard deviation now. This chart shows that geopolitical shocks reduce output through spending decisions made by households and firms, lift inflation through price channels, and weaken currencies through financial and external adjustment.
The broader implication is that supply security now carries a direct macro price. Maritime corridors, tanker insurance, refinery access, data infrastructure, and cross-border finance sit much closer to the center of the business cycle than they did under the earlier assumption of a largely rules-based and low-friction global system. Fertilizer markets, food security, reversals in capital flows, and abrupt adjustments in asset prices are all part of the chain of downside risks, especially for economies with weaker fiscal frameworks and lower external reserves.