

[INTEL REPORT] Q2 Macro-geopolitical outlook
Hormuz, U.S.–China leverage, and Europe’s energy constraint
Table of contents:
Introduction.
Inflation reopens.
Energy and chokepoints.
Global trade.
U.S.–China.
Europe’s energy decline continues.
East mediterranean gas and the new energy geography.
Audio Note: Before we begin, remember that if you’re accessing this article through the Substack app, you can listen to it instead of reading it. The MarketOps section is best suited for this format.

Before you begin, remember that you have an index with the newsletter content organized by clicking on the image below.

Introduction
Growth remains alive, yet price formation has moved from demand cycles into shipping lanes, fuel markets, mineral chains, defence budgets, and regulatory systems. The global economy still expands, but each point of growth now carries a higher security cost.
Today we review the pressure points that define the current environment. Inflation has reopened through energy, fertilizers, freight, and expectations. Hormuz has become a macro variable because oil, LNG, refined products, and insurance prices move through the same corridor. Global trade has entered a selective phase, where AI infrastructure expands while tariffs, standards, and compliance rules reshape market access.
To go deeper you can check this:
The U.S.–China relationship sits at the centre of this structure. Both powers use the same channels for commerce and leverage: rare earths, chips, agriculture, Treasury holdings, industrial capacity, and maritime routes. Europe faces a harsher version of the same problem. Its energy model has shifted away from Russia, but the replacement system depends on LNG, external suppliers, cloud platforms, AI hardware, and fiscal room that bond markets continue to test.
The East Mediterranean has gained strategic weight within this context. Gas fields, pipelines, LNG terminals, electricity cables, hydrogen plans, and maritime claims now form part of a larger energy map shaped by Gulf disruption and European supply risk. The region offers optionality, but also concentrates infrastructure, diplomacy, and security inside one contested space.

Inflation reopens
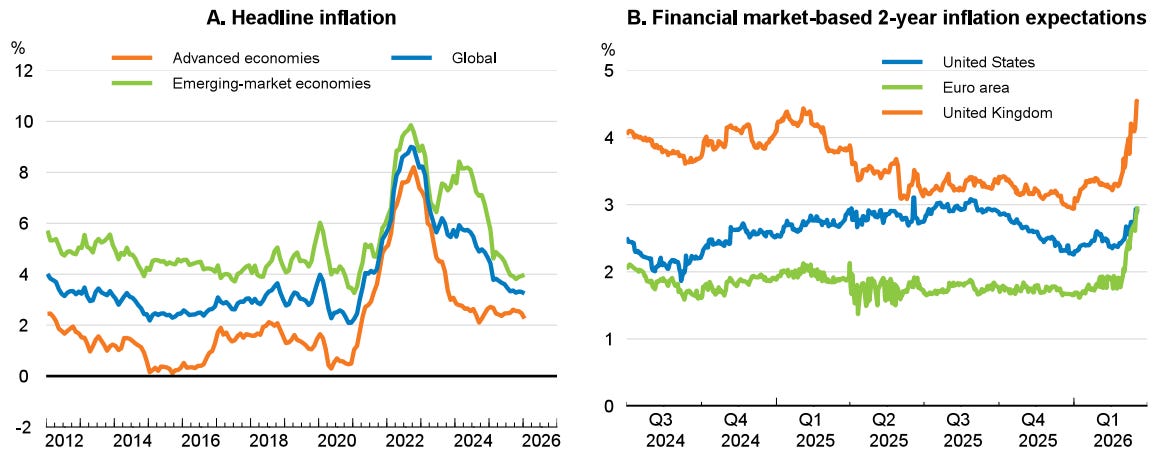
The central feature of this macro regime is the coexistence of positive growth with a renewed inflation impulse. The IMF places global growth at 3.1% in 2026 and 3.2% in 2027, below the recent pace of about 3.4% seen in 2024 and 2025 and below the 3.7% average recorded during 2000–2019. Global headline inflation is expected to rise to 4.4% in 2026 before easing to 3.7% in 2027, which turns the 2026 cycle into a test of disinflation credibility rather than a clean continuation of the previous normalization path.
The Middle East war has changed the macro baseline because the shock enters through commodity markets, inflation expectations, transport costs, and financial conditions at the same time. The IMF states that, absent the war, its 2026 growth forecast would have received a slight upward revision to 3.4%. The downward move to 3.1% therefore comes from the conflict shock, partly offset by recent strong data and lower tariff rates. The current slowdown reflects an external constraint on supply and confidence rather than a broad collapse in private demand.
The baseline also hides a wide dispersion across economies. Advanced economies show a more contained revision, while commodity-importing emerging and developing economies carry the largest pressure. These countries face a triple squeeze from higher energy bills, weaker external balances, and tighter financing conditions. The IMF’s downside scenarios show the scale of that vulnerability. Under an adverse path with larger and more persistent energy-price increases, global growth falls to 2.5% in 2026 and inflation reaches 5.4%. Under a more severe path with greater damage to regional energy infrastructure, global growth falls near 2%, while headline inflation moves above 6% by 2027.
The OECD reinforces this picture with a slightly weaker growth profile. It projects global GDP growth at 2.9% in 2026 and 3.0% in 2027. The same outlook shows that the energy-price surge and the Middle East conflict raise costs and lower demand, while strong technology-related investment, lower effective tariff rates, and the momentum inherited from 2025 provide support. This creates a two-engine global economy. One engine is constrained by fuel, freight, insurance, and import costs.
Early 2026 activity data show that the world entered the shock with strength across both services and manufacturing. The OECD notes that global growth remained solid in 2025, expanding at an annualized pace of about 3.25% in the second half of the year. Private consumption and investment were major drivers across many economies, while technology-related business investment carried the U.S. expansion through tariff headwinds. In Asia and the United States, technology-related industrial production continued to rise in the opening months of 2026, supported by stronger capital-expenditure intentions among large listed technology firms.
This detail changes the interpretation of the global cycle. The world is dealing with a supply shock layered on top of an investment upswing. The AI capital cycle supports manufacturing, electricity demand, high-end components, and corporate spending. The energy shock pushes in the opposite direction by compressing margins, lowering household purchasing power, increasing transport costs, and raising the hurdle rate for investment in energy-intensive sectors. The result is a macro regime where the same economy can show strong capex in strategic technology and weak real-income momentum in consumer-facing sectors.
Inflation has reopened through the energy channel. The OECD expects G20 inflation to rise from 3.4% in 2025 to 4.0% in 2026, then ease to 2.7% in 2027. In advanced G20 economies, headline inflation rises from 2.5% to 3.5% in 2026, while core inflation stays around 2.6% before easing in 2027. In the United States, higher energy prices more than offset the reduction in effective tariff rates, lifting projected headline inflation from 2.6% in 2025 to 4.2% in 2026.
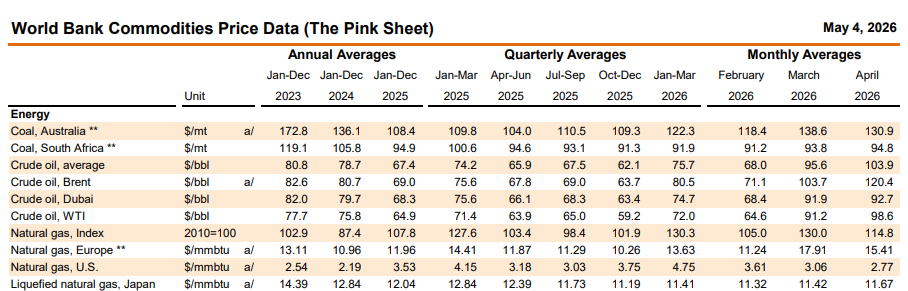
The World Bank projects overall commodity prices to rise 16% in 2026, driven by energy, fertilizer, and several key metals. Its energy price index is forecast to rise 24% in 2026, reaching its highest level since the 2022 energy shock. The same forecast describes the 2026 energy move as a near 40% shock relative to January expectations. This means the macro forecast now depends on physical routing, spare production capacity, strategic reserves, and conflict duration.
The WTO projects a slowdown in global trade growth during 2026, while AI-related goods create an offsetting source of demand. Continued strength in AI-enabling goods trade could add 0.5 percentage points to world merchandise trade growth in 2026. This turns trade into a split system. Strategic technology flows remain strong, while energy-linked freight costs, security risks, insurance premia, and compliance barriers weigh on broader merchandise movement.
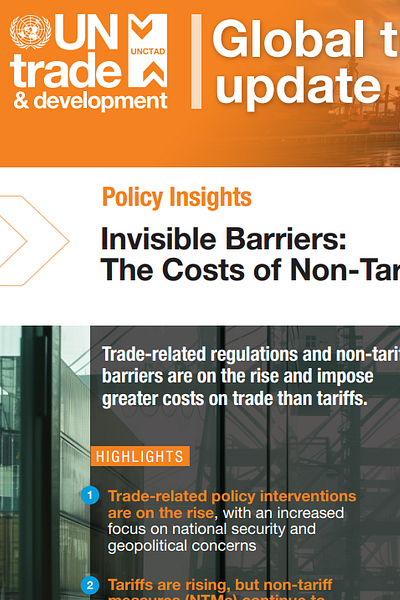
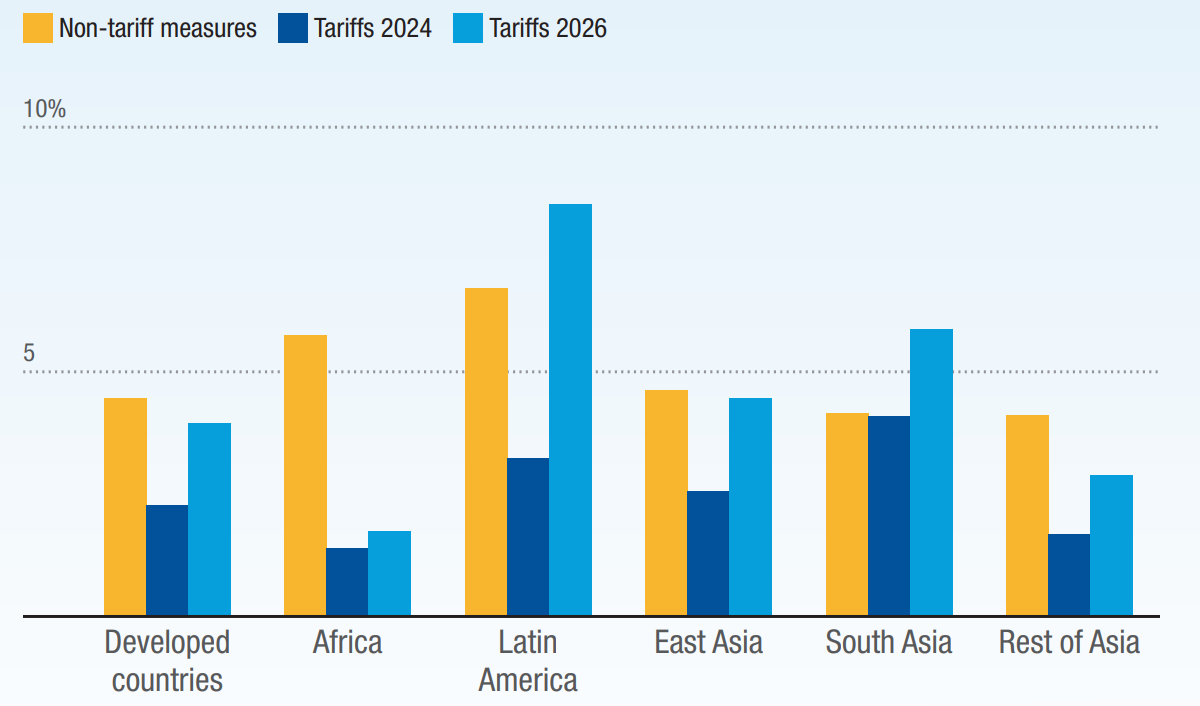
UNCTAD reports that non-tariff measures now impose higher export costs than tariffs for 88% of countries. In 2025, tariffs on exports rose 10% for developed economies, 16% for developing economies, and 18% for least-developed economies. For smaller exporters, technical regulations, certification requirements, sanitary rules, and product standards have become a larger obstacle than headline tariff rates.
Fiscal policy sits under pressure from the same shock structure. Finances entered 2026 with weak debt dynamics, while the Middle East war added a new source of pressure through energy disruption, tighter financial conditions, and demands for household support. Governments now face a narrow balance between cushioning the energy shock and preserving fiscal credibility. This is one reason the macro regime has become more state-driven. Defence spending, energy subsidies, industrial policy, reconstruction finance, and debt service all compete for the same fiscal space.
The result is a global economy that still expands, but expands through a narrower and more political channel. Growth depends on AI investment, defence production, energy substitution, and public-sector intervention. Inflation depends on chokepoints, commodity flows, and expectations. Trade depends on standards and strategic access. Financial stability depends on the capacity of bond markets to absorb larger public-sector needs. May 2026 therefore marks a shift from a classic business-cycle framework toward a security-constrained macro framework, where physical infrastructure, military risk, energy routing, and fiscal credibility determine the path of output and prices.
Energy and chokepoints
The Strait of Hormuz handled around 20 million barrels per day of crude oil and oil products in 2025, close to 25% of world seaborne oil trade. The route also carried around 110 bcm of LNG, equal to almost one-fifth of global LNG trade. Qatar and the UAE sit at the centre of this exposure because around 93% of Qatar’s LNG exports and 96% of UAE LNG exports passed through Hormuz in 2025. This turns a local maritime disruption into a world pricing event because Asian utilities, European importers, petrochemical firms, airlines, refiners, and shipping operators compete for the same displaced molecules and cargoes.
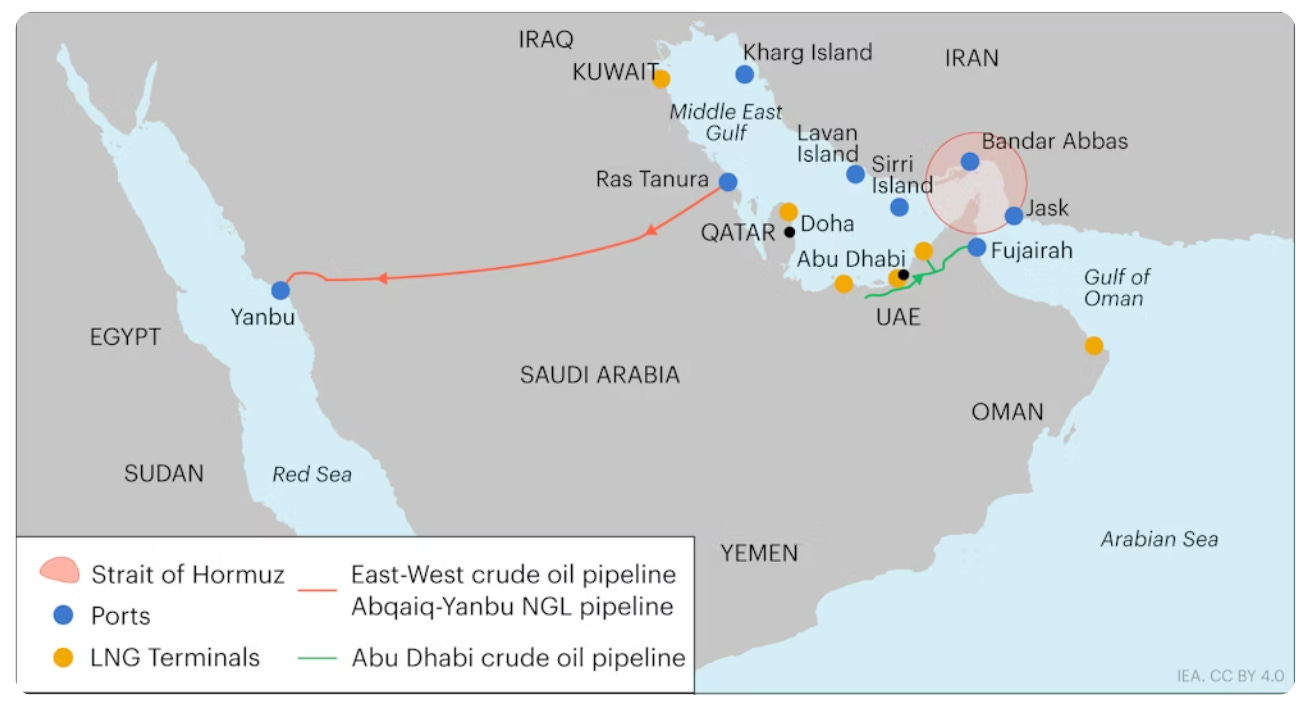
Saudi Arabia and the UAE hold the main operational bypass capacity through pipelines that can redirect crude flows toward the Red Sea and Fujairah. The available rerouting capacity is estimated between 3.5 million and 5.5 million barrels per day, which covers only a fraction of normal Gulf export flows. Iran, Iraq, Kuwait, Qatar, and Bahrain remain tied to the Strait for most oil exports. The shock therefore prices the difference between gross energy supply and deliverable energy supply. A barrel inside the Gulf has a market value only when it can reach a buyer, pass through insurance, secure shipping, clear port risk, and arrive inside a refinery schedule.
The gas shock has a separate macro channel because LNG markets have thinner buffers than oil markets. The IEA estimates that transit disruption through Hormuz has reduced LNG supplies from Qatar and the UAE by more than 300 million cubic metres per day since 1 March, equal to more than 2 bcm per week. Ras Laffan, the world’s largest liquefaction facility, has been offline since the 2 March attack, while associated gas output has also been affected by oil-field shut-ins. This creates pressure on Asian spot LNG prices, European gas benchmarks, power prices, fertilizer costs, and industrial input prices.
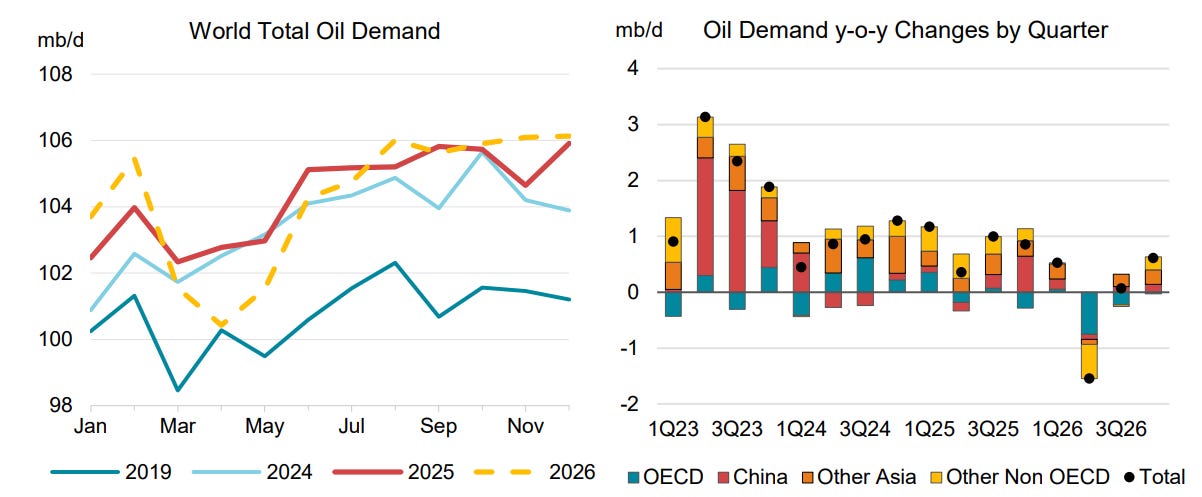
Asia carries the largest direct import exposure. About 80% of oil and oil products moving through Hormuz in 2025 went to Asia, and almost 90% of LNG volumes exiting the Persian Gulf through the Strait also went to Asia. China, India, and Japan are among the main crude importers exposed to the route, with China and India together receiving 44% of crude exports passing through Hormuz. This gives the conflict an Asian growth channel. Energy-importing economies face higher import bills, weaker terms of trade, margin compression, and pressure on administered fuel systems.
Europe faces a different exposure. Its direct share of Gulf crude flows is smaller, with around 4% of the region’s crude routed into Europe, yet the price effect reaches Europe through global Brent pricing, LNG competition, electricity markets, aviation fuel, fertilizer, and industrial chemicals. The ECB describes the shock as a negative supply shock for the euro area because Hormuz affects LNG, refined products, aluminium, helium, sulphur, and fertilizers. These commodities enter the cost base of electricity, aircraft fuel, food production, manufacturing, construction, and strategic industries.
The inflation channel is visible in Europe’s April data. Euro area headline inflation rose to 3% in April, driven by a 10.9% increase in energy prices, while inflation excluding energy fell to 2.2%. This composition matters because the shock comes from imported energy and critical inputs rather than from broad domestic overheating. The ECB also reported longer delivery times, rising input costs, and supply shortages, with the latest observations for April 2026. That combination creates a policy dilemma because monetary policy can anchor expectations, while the physical shortage originates outside the domestic credit cycle.
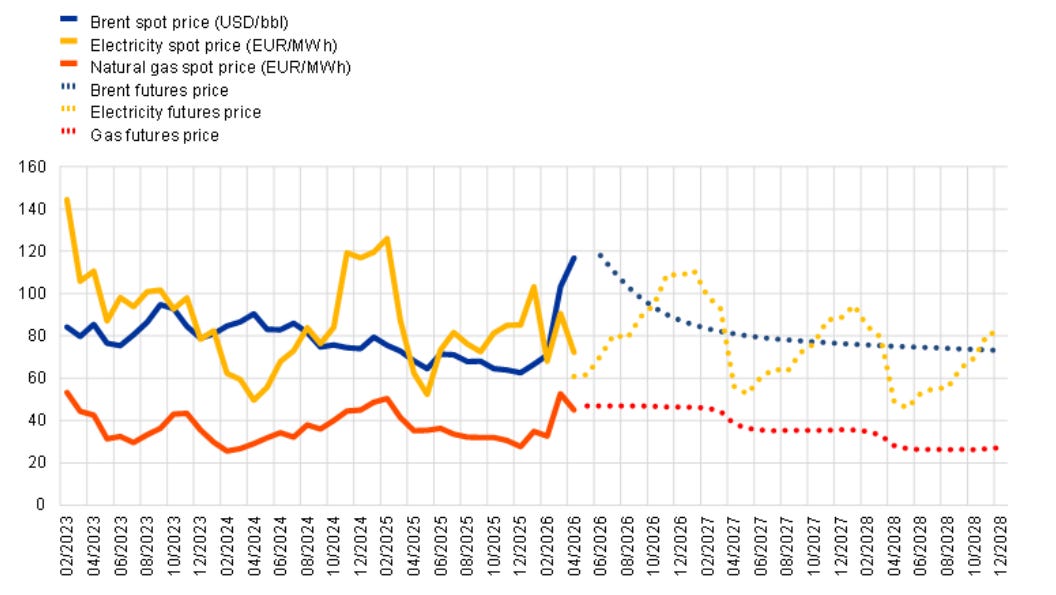
The oil-price path remains the central market gauge. Brent averaged was $103 per barrel in March and expects a peak near $115 per barrel in the second quarter of 2026. The same outlook keeps a risk premium through the forecast period because supply disruption uncertainty keeps prices above pre-conflict levels. The forecast sees Brent moving below $90 in the fourth quarter of 2026 and averaging $76 in 2027, based on a gradual return of flows and lower shut-ins. This makes the forecast path contingent on shipping access, infrastructure damage, spare capacity, inventories, and diplomatic sequencing.
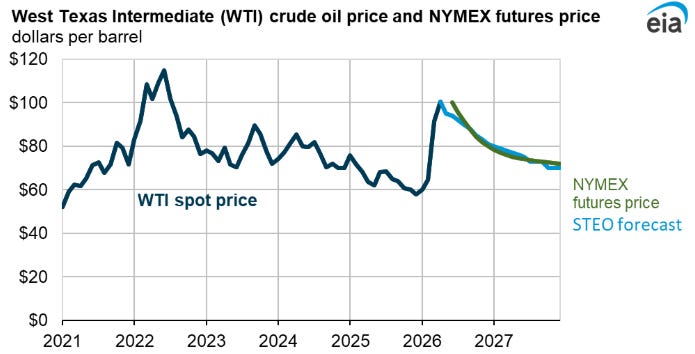
The Brent-WTI spread shows the geographic nature of the shock. The EIA states that the spread averaged $12 per barrel in March and peaks near $15 per barrel in April because Brent carries greater exposure to Middle East flows, shipping costs, and Asian consuming markets. This spread turns the conflict into a regional balance-sheet issue. U.S. refiners, European buyers, Asian utilities, Gulf exporters, and tanker owners experience the same conflict through different price curves.
The World Bank projects energy prices to rise 24% to their highest level since 2022. Overall commodity prices are forecast to rise 16%. Fertilizer prices are projected to increase 31%, driven by a 60% jump in urea prices. This links the Hormuz shock to food affordability because natural gas is a key feedstock for nitrogen fertilizers, while transport fuel affects every stage of agricultural logistics. The World Bank warns that prolonged conflict pressure could push up to 45 million more people into acute food insecurity.
The latest monthly commodity data reinforces the same direction. The World Bank’s May commodity update shows the energy price index rising 12.1% in April, driven by crude oil gains of 8.7%. Food prices edged up 1.5%, fertilizer prices jumped 14%, raw materials rose 2.5%, and metals gained 1.4%. These moves show that the energy shock has started to move across adjacent commodity baskets rather than staying isolated inside crude oil.
Strategic reserves can smooth the shock, but they cannot recreate Gulf export capacity. The market now prices the speed at which governments release reserves, the capacity of refineries to adapt crude slates, the availability of tankers, the cost of war-risk insurance, the integrity of pipelines, and the ability of Gulf producers to sustain production under threat. Saudi Aramco is warning that the oil market could lose around 100 million barrels per week if the disruptions continue at the current rate and Hormuz remains closed. This figure gives the shock a weekly depletion rhythm that matters for inventories, refinery planning, and political pressure.
Global trade
The global trade regime has moved into a split structure. One side carries the weight of tariffs, energy shocks, insurance costs, route risk, sanctions screening, and regulatory barriers. The other side carries the force of the AI capital cycle, where chips, servers, networking equipment, electrical systems, cooling units, data-centre components, and advanced manufacturing inputs keep crossing borders because artificial intelligence requires a large physical supply chain.
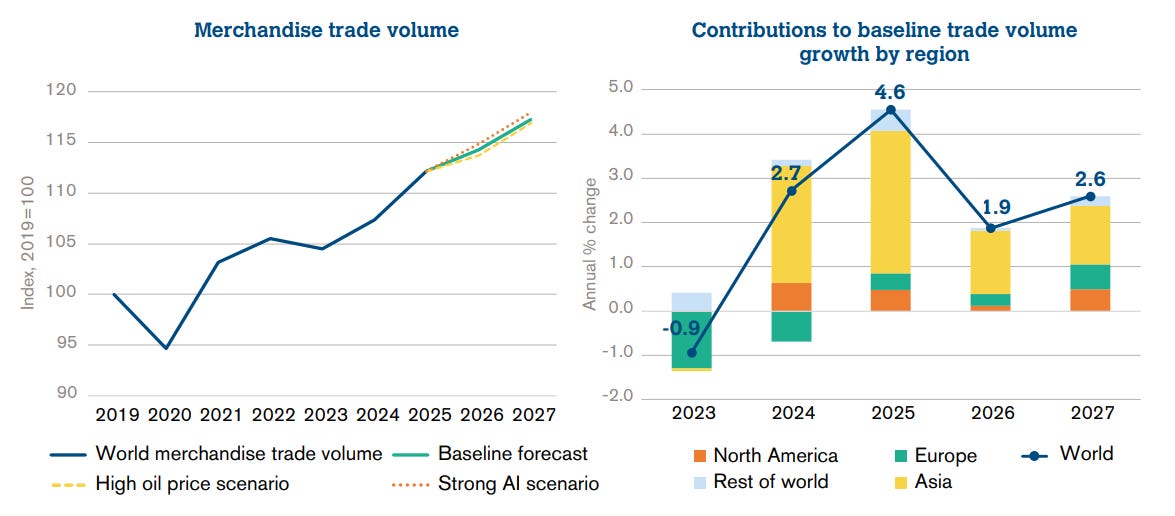
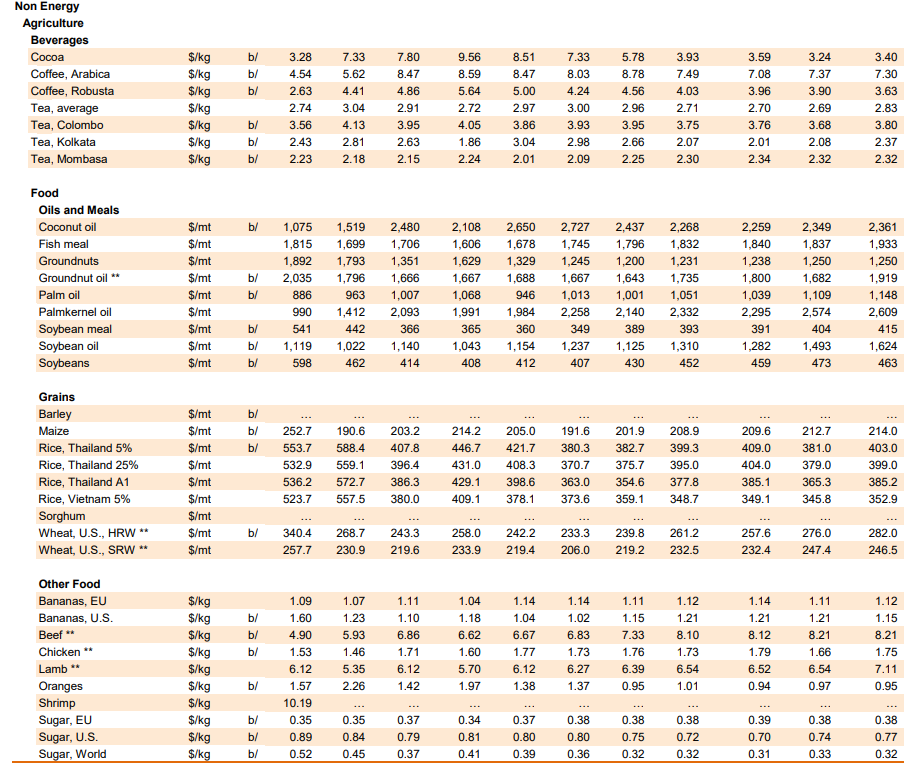
Merchandise trade volume is projected to fall from 4.6% growth in 2025 to 1.9% in 2026, then recover to 2.6% in 2027. Services trade volume is projected to ease from 5.3% in 2025 to 4.8% in 2026, then rise to 5.1% in 2027. Goods and services trade grew around 4.7% in 2025, above world GDP growth of 2.9%, while 2026 places trade growth near GDP growth. This means trade has shifted from an expansion phase to a filtering phase, where strategic sectors expand while broad merchandise flows face macro and policy friction.
The trade rebound came from two sources with different political meanings. First, companies brought imports forward ahead of expected tariff changes. Second, AI-related demand created a hardware boom across semiconductor supply chains, server systems, and electronic components. That combination lifted trade before the full impact of new policy barriers entered the system. The frontloading effect fades, while AI hardware demand remains a support factor. The result is a trade cycle where last year’s strength creates this year’s comparison problem, and where the quality of trade growth matters more than the headline number.
AI has become the strongest structural trade engine because it transforms digital demand into physical shipments. AI-enabling goods trade reached $4.18 trillion after 21.9% annual growth. These goods accounted for 42% of global trade growth, despite representing a smaller share of total merchandise trade. Asia remained the global hub with 62% of AI-related goods trade, while North America became the fastest-growing market and accounted for 16% of the total. This structure gives AI a geopolitical footprint because the model layer depends on the chip layer, the chip layer depends on capital equipment, and the equipment layer depends on minerals, power systems, logistics, and standards.
The earlier trade model rewarded low-cost production and efficient container movement. The current model rewards secure access to compute inputs, energy, advanced components, trusted suppliers, and export licenses. A server shipment now reflects a chain of permissions. It requires chips, memory, networking systems, cooling equipment, energy infrastructure, cybersecurity rules, and destination controls. Trade remains open in aggregate, while the strategic layer becomes more selective.
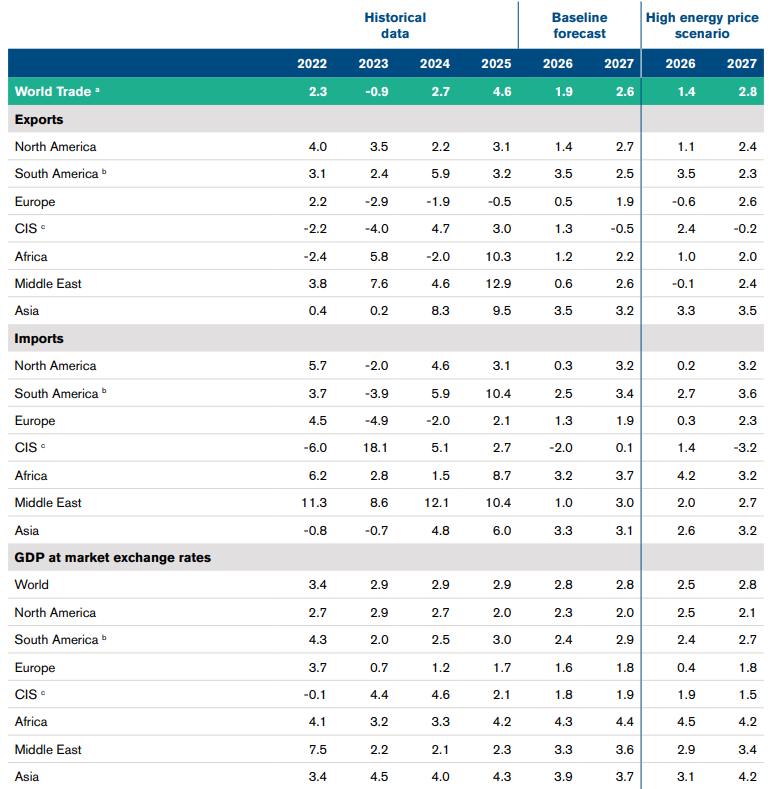
The tariff layer adds uncertainty to that selective structure. The OECD estimates that changes in U.S. bilateral tariff rates lowered the effective tariff rate on U.S. merchandise imports to 9.9%, compared with the 14% assumption used in its outlook. The same assessment describes a new 10 percentage point U.S. tariff applied across countries, with exclusions for sector-specific goods and exempted products, including many pharmaceuticals and semiconductor-related goods. This gives companies a changing tariff map where country exposure, product classification, exemption status, and origin rules shape sourcing choices.
The tariff map has a second effect, it extends planning risk. Firms can reroute supply chains around a tariff, but repeated rule changes alter inventory strategy, contract length, supplier selection, customs classification, and hedging costs. Trade policy now affects the working-capital cycle of companies. Importers carry more inventory when they expect border costs to rise. Exporters diversify buyers when access terms become unstable. Multinationals split production when rules of origin become strategic.
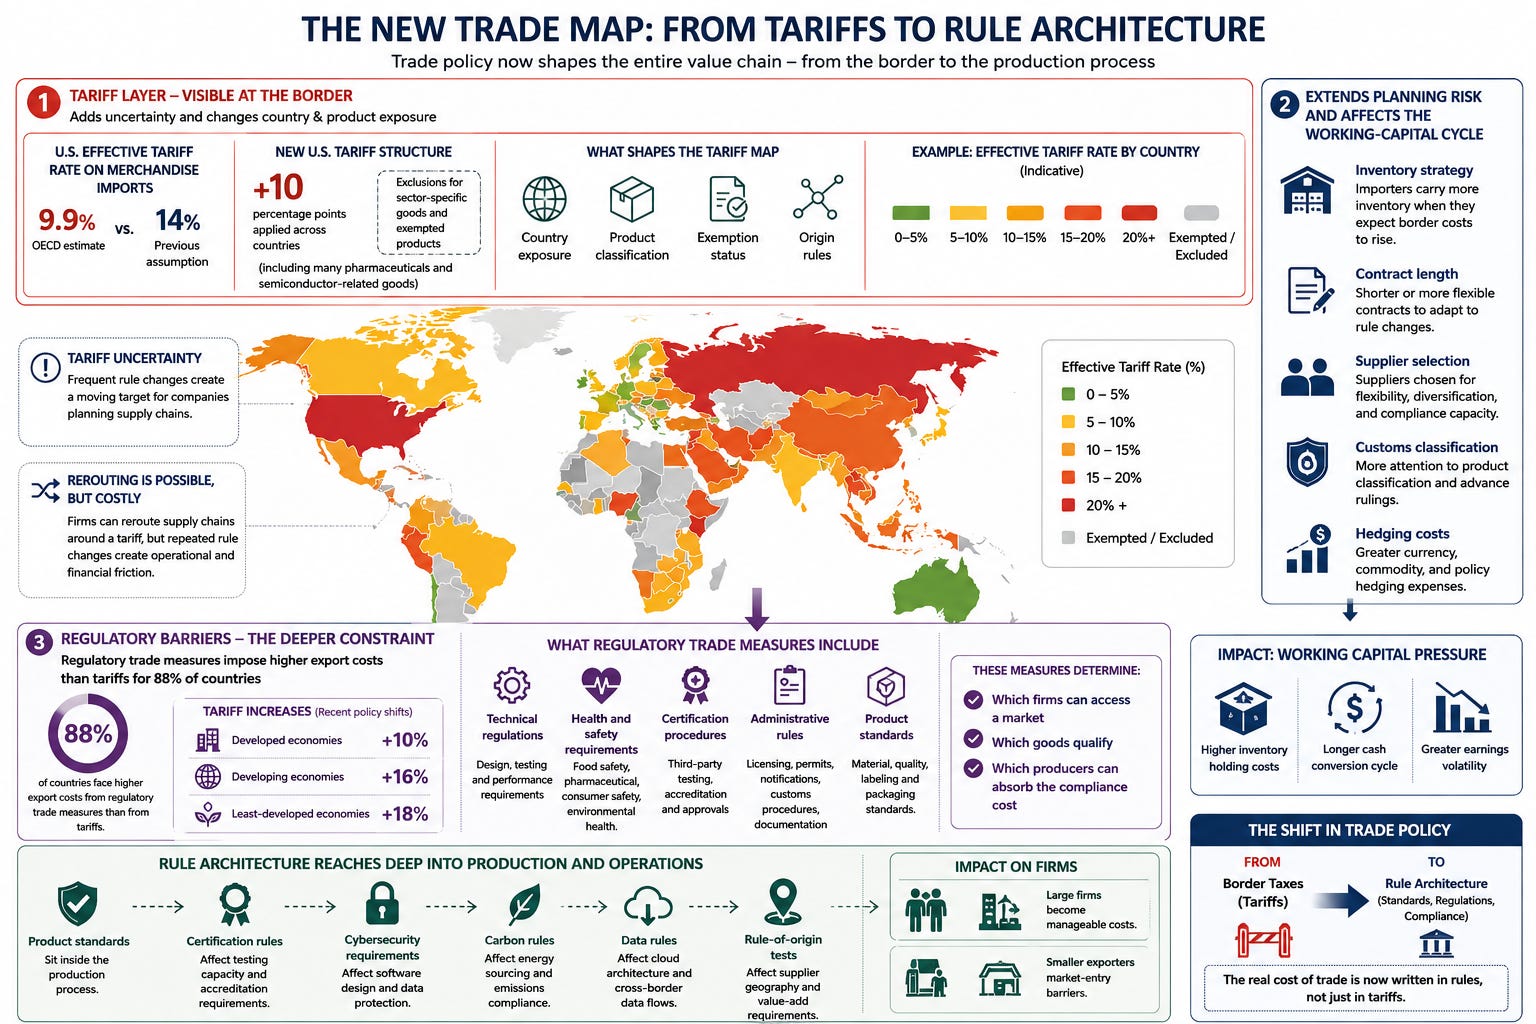
Regulatory barriers have become the deeper trade constraint. Tariffs rose by 10% for developed economies, 16% for developing economies, and 18% for least-developed economies. Yet regulatory trade measures now impose higher export costs than tariffs for 88% of countries. These measures include technical regulations, health and safety requirements, certification procedures, administrative rules, and product standards. They determine which firms can access a market, which goods qualify, and which producers can absorb the compliance cost.
This shifts the centre of trade policy from border taxes to rule architecture. A tariff is visible at the border. A product standard sits inside the production process. A certification rule affects testing capacity. A cybersecurity requirement affects software design. A carbon rule affects energy sourcing. A data rule affects cloud architecture. A rule-of-origin test affects supplier geography. For large firms, these rules become manageable costs. For smaller exporters, they become market-entry barriers.
Data shows the development impact of this rule-based trade system. Least-developed economies lose around 10% of their exports to G20 markets because firms lack the capacity to meet regulatory requirements. Smaller exporters face higher costs when local testing and certification facilities are scarce, since products require external verification before market entry. This creates a trade hierarchy based on compliance capacity. The firm with legal teams, testing access, documentation systems, and certification budgets enters the market. The firm with production capacity alone faces exclusion from high-value markets.
Regulatory convergence offers one of the largest trade gains inside the current system. Rules or recognizing standards can reduce regulatory-measure costs by 15% to 30%. In Africa, limited cooperation could reduce costs by 30% to 40% in sectors such as agriculture and manufacturing. This shows that trade expansion depends less on classical tariff cuts and more on mutual recognition, shared testing systems, transparent documentation, and regional standards architecture.
A country or bloc that defines safety rules, digital rules, carbon rules, product rules, payment rules, and certification rules can shape the direction of trade. The largest markets gain leverage because exporters adapt to their requirements. This creates a form of regulatory gravity. Producers build around the rulebook of the market they want to enter. Trade flows follow demand, but production systems follow standards.
The AI trade boom intensifies this regulatory gravity. AI hardware crosses borders, but each shipment sits inside controls on chips, cloud access, cybersecurity, data governance, model safety, export licensing, and critical minerals. The value of trade has moved toward goods that carry strategic meaning. A chip is a commercial product, a defence input, a data-centre component, a productivity asset, and a geopolitical lever. A server rack is infrastructure for commerce, surveillance, science, finance, and military logistics.
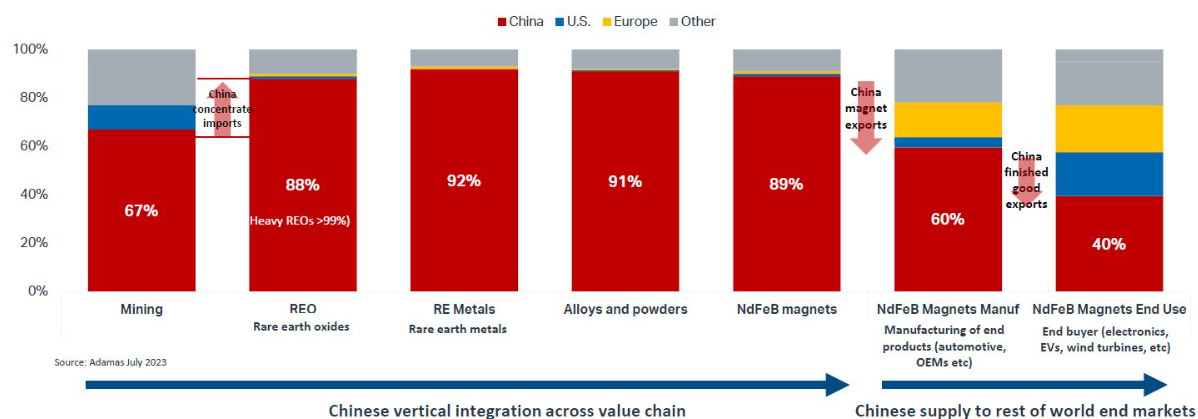
China’s role in this structure is central because manufacturing depth, mineral processing, component scale, and export capacity give it leverage across the trade stack. China uses rare earths and bilateral commercial agreements as tools of bargaining, while stressing that China’s financial strength still depends on exports and dollar inflows. That combination creates a system of conflict inside dependence. China gains leverage from supply-chain concentration. The United States gains leverage from demand, finance, technology standards, and security alliances. The trade regime becomes a negotiation over who controls the bottleneck.
For Europe, the same regime creates a strategic dilemma. European firms need AI hardware, cloud infrastructure, energy inputs, and export access. European regulators want sovereignty through rules, but the physical supply chain for AI and the energy shock sit outside Europe’s full control. This gives Europe strong influence over market access and weaker influence over upstream technology capacity. The result is a continent that can write standards, enforce compliance, and shape consumer-market rules, while depending on external actors for several inputs that define the next productivity cycle.
The investment implication is that trade exposure must be read through bottlenecks rather than through country labels alone. The relevant question is where a company sits inside the chain of controlled inputs, certification rules, tariff exposure, energy intensity, and AI infrastructure demand. A firm tied to AI hardware can benefit from the capex boom while facing export-license risk. A firm tied to consumer imports can face margin pressure from tariff shifts and freight costs. A firm selling into regulated markets can face growth limits from certification costs. Trade beta has become rule beta, energy beta, and bottleneck beta.