

Why your trading strategy is basically a magic 8-ball (and other uncomfortable truths)
Where the thrill of Las Vegas collides with the stakes of Wall Street

Introduction
Let’s begin our adventure into the turbulent world of trading with a simple game. Picture yourself strutting into a Las Vegas casino. Neon lights glimmer overhead, the cacophony of slot machines fills the air, and a smooth-talking dealer at a blackjack table flags you down. He flashes a grin and says:
“Heads, I give you $1. Tails, you give me $1. Wanna play?”
Being a rational human, you quickly realize the odds are 50/50 with no house edge, so you politely decline. “No thanks, buddy,” you say, “I have actual slot machines to conquer.”
But then he winks and changes the stakes:
“Heads, you still get $1. Tails... you owe me $10,000.”
Suddenly, the table you’re standing at feels more like a trap than a game. The potential downside is astronomical compared to your modest upside. Sound familiar? Welcome to the real-life stock market, where sometimes you’re effectively risking $10,000 to win a meager $1. If that sounds unfair, well, it often is.
And yet, people flock to this environment—just like they flock to the bright lights of Vegas—lured by glitzy success stories and the dream of hitting the jackpot. In the markets, randomness often dresses up as “skill,” and our brains are conditioned to see patterns in what might just be noise. We’re going to shine a spotlight on why many traders confuse luck with genius, why your fancy Python code may not be telling you the truth, and why the phrase “I have a system!” is about as reliable as claiming “I know a foolproof way to beat the casino.”
Buckle up and keep an extra stash of chips in your pocket—this might be one roller-coaster of a ride (though if you’re in Vegas, it’s more likely a roller-coaster built through a pseudo-Egyptian pyramid or under a mini Eiffel Tower).
Let's start with the coin flip conspiracy, or how randomness plays dress-up. As you know, randomness is a trickster; it is the greatest magician in Vegas—it dazzles us with illusions, making us believe we see patterns and order where there’s only chaos. You know that feeling when you see red hit on the roulette wheel six times in a row and feel “black is definitely next”? That’s randomness performing its show, inviting you to place a big bet on black. Sometimes it works; sometimes it doesn’t. It’s a coin flip, after all.
Consider a fair coin. If you flip it ten times, the probability of getting all heads is:
That’s a 0.097% chance—tiny. But if you flip that coin ten million times, streaks of ten heads will happen more often than you might guess—simply because you’re trying so many times.
Translating this to trading: imagine you see a stock go up ten days in a row. You might interpret that as a sure bullish signal, much like seeing red come up six times and concluding black must be next. But in the same way that a single roulette wheel spin doesn’t remember what happened before, the stock might just be on a random streak.
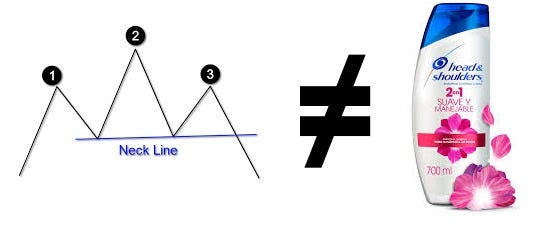
So, the next time you see a “head-and-shoulders formation” or some ominous-sounding technical pattern, ask yourself: Is this a genuine signal or am I reading too much into a sequence of random price moves? Sure, patterns exist, but randomness can look exactly like skill if you don’t analyze it carefully.
Do you understand what I mean? Sometimes, patterns; sometimes, hallucinations—I want you to take a look of the appendix below and comment which one of them you like most.
Remember Tamagotchis? Those little digital pets we obsessively fed and cared for? In the stock market, your “digital pet” is your price chart. You feed it more data, watch it for fluctuations, clean up when it “poops” out a loss. The problem is that humans are excellent at seeing patterns—even when there aren’t any. If you stare at a chart long enough, you’ll start to see shapes: triangles, rectangles, dinosaurs, maybe even Elvis.
Let’s illustrate how something completely random can look suspiciously like a real stock chart. The following snippet simulates a random walk, akin to a drunk person staggering around. Don’t worry if you’re not a Python pro; the logic is simple:
import numpy as np
import matplotlib.pyplot as plt

# Simulate a random walk
np.random.seed(42)
steps = np.random.choice([-1, 1], size=1000)
price = np.cumsum(steps)

plt.plot(price)
plt.title("Stock price: Literally just a drunkard's walk")
plt.xlabel("Time")
plt.ylabel("Price")
plt.show()
I think I'm starting to see heads and shoulders everywhere 😵💫.
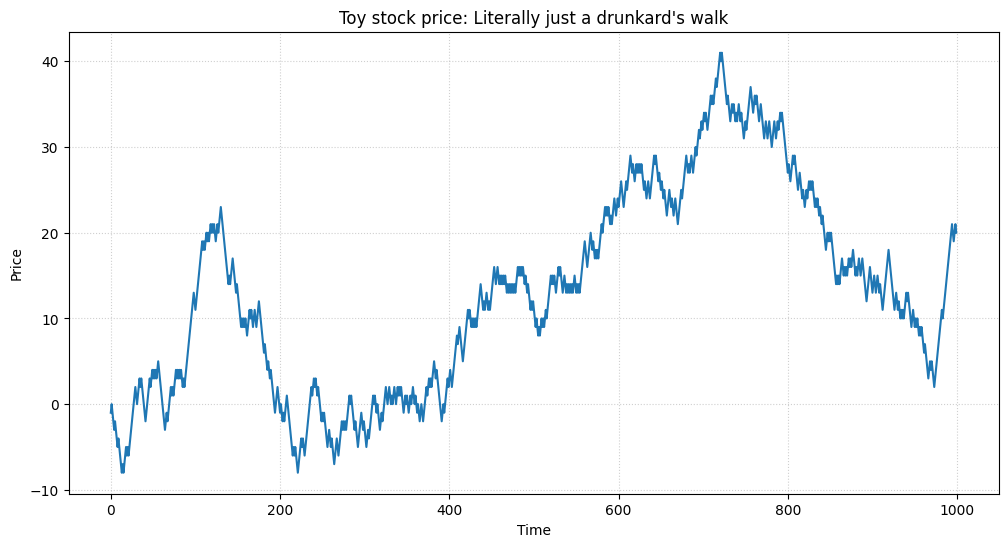
Stare at it for too long and you’ll start to see breakouts, support levels, or cosmic omens. In reality, it’s just random data. We humans are wired to look for patterns (useful for spotting lions in the savannah), but this superpower turns against us in the markets.
Our brains are so pattern-hungry that we see faces in clouds or on the front of cars—this phenomenon is called pareidolia. When it comes to financial charts, the same phenomenon makes us see shapes and signals where there might be none. The big lesson: attention alone doesn’t equal accuracy. Without statistical rigor, you might just be labeling random squiggles.
Now let’s do a mental game—I’m sure my buddy Jaume would enjoy this one. Place 10,000 monkeys at 10,000 shiny trading terminals. Each monkey randomly hits BUY or SELL every day. After a year, some monkeys will have done extraordinarily well, purely by chance—like picking the right color on roulette night after night.
We single out the top 100 monkeys and call them “Genius Monkeys.” They’re praised on TV, get multi-million-dollar book deals, and start selling courses on “Banana-Fueled Fibonacci Trading Secrets.” Everyone forgets the other 9,900 monkeys that lost money. This is survivorship bias: we notice the lucky survivors and ignore the mountain of losers.
You can simulate this with:
import numpy as np
import pandas as pd
import matplotlib.pyplot as plt

# Create toy data
np.random.seed(42)
num_days = 252  # One trading year
data = pd.DataFrame({
    'open': np.cumprod(1 + np.random.normal(0, 0.01, num_days)) * 100  # Simulated price series
})

# Generate a simple strategy signal
strategy_signals = pd.Series(np.random.choice([1, -1, 0], size=num_days))

# Parameters
num_simulations = 1000  # Number of random strategies to generate
initial_capital = 10000  # Initial capital

# Function to calculate the performance of a strategy
def calculate_performance(signals, prices):
    returns = prices.pct_change().shift(-1)  # Daily returns
    strategy_returns = signals * returns  # Strategy returns
    strategy_returns = strategy_returns.fillna(0)  # Replace NaN values with 0
    capital_curve = (1 + strategy_returns).cumprod() * initial_capital
    final_performance = capital_curve.iloc[-1] - initial_capital
    return final_performance

# Performance of the original strategy
strategy_performance = calculate_performance(strategy_signals, data['open'])

# Generate random strategies and calculate their performances
random_performances = []
for _ in range(num_simulations):
    random_signals = np.random.choice([1, -1, 0], size=num_days)
    performance = calculate_performance(random_signals, data['open'])
    random_performances.append(performance)

# Analyze the results
random_performances = np.array(random_performances)
random_mean = np.mean(random_performances)
random_std = np.std(random_performances)

# Compare the strategy's performance with the random strategies
if strategy_performance > random_mean + 2 * random_std:
    result = "The strategy outperforms randomness and is worth considering."
elif strategy_performance < random_mean + random_std:
    result = "The strategy does not outperform randomness and should be discarded."
else:
    result = "The strategy is in an intermediate zone and could be improved."
If you run the test with real signals, you’ll probably get this result: 'The strategy does not outperform randomness and should be discarded.'
Here the reason:
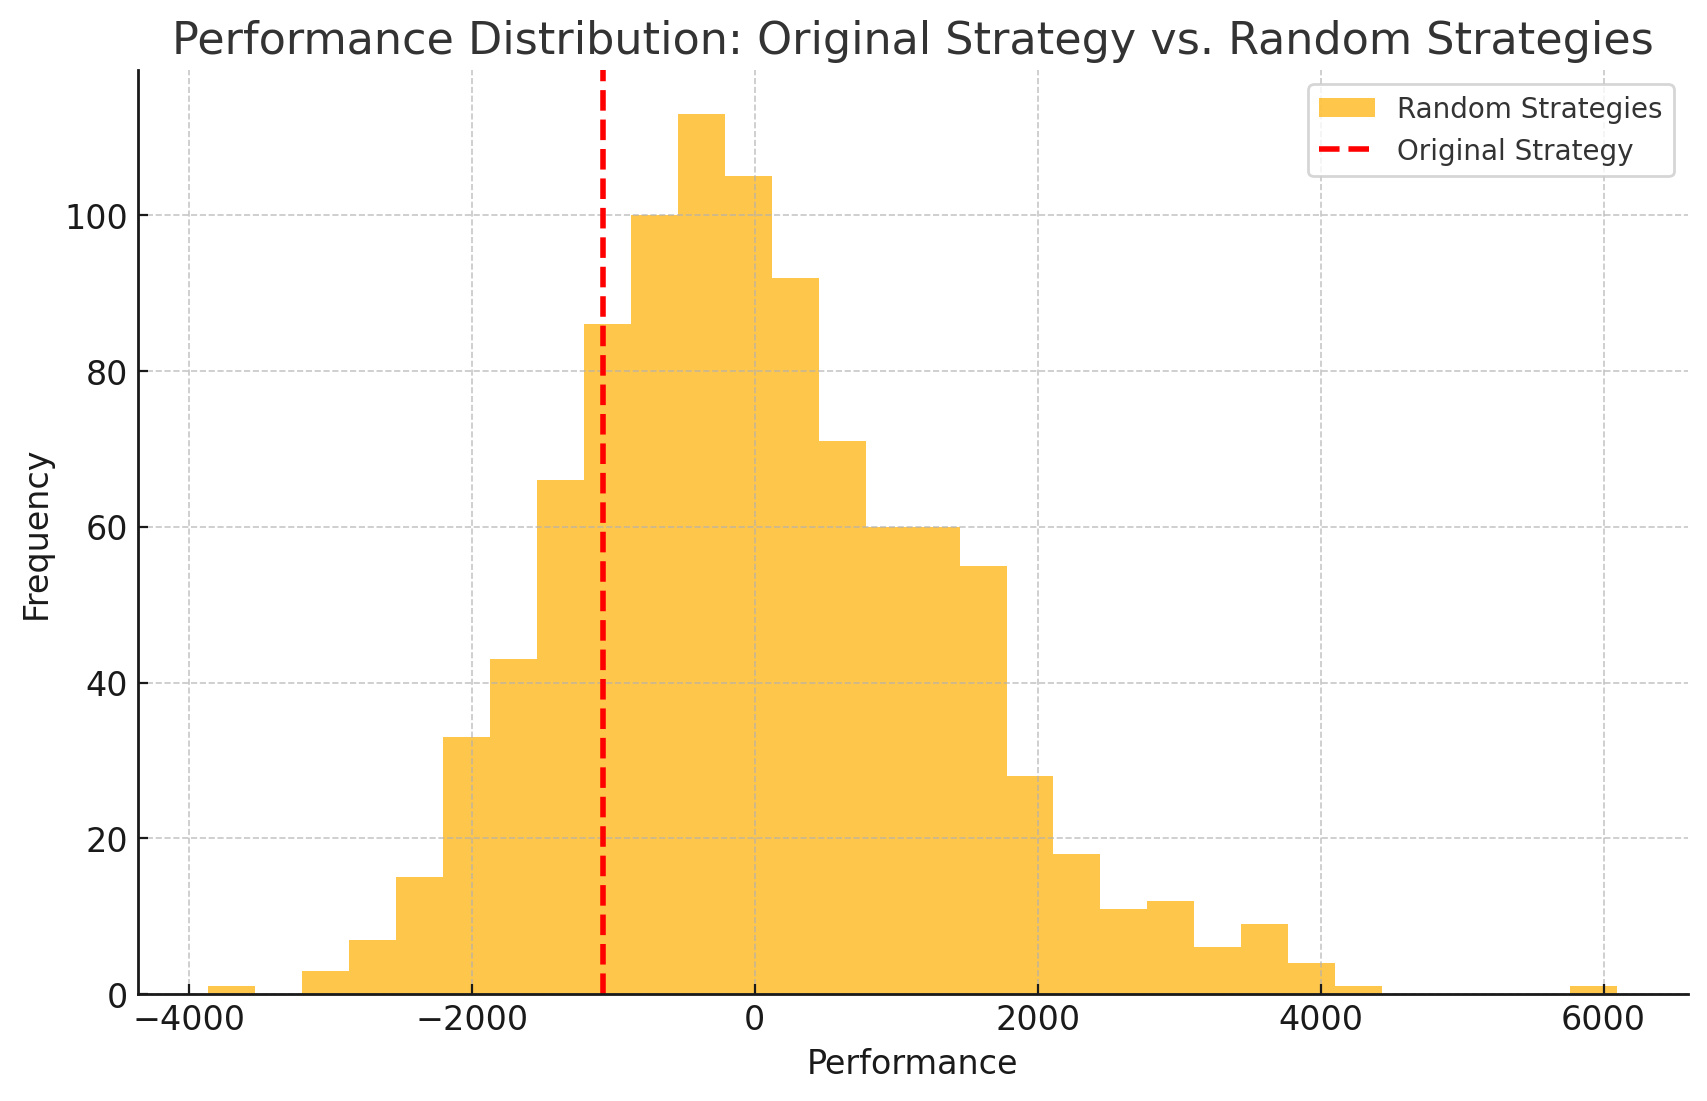
You might see something like Number of geniuses: 300. Those 300 might write books and claim they found the secret formula, but in reality, it’s just chance. The same phenomenon exists in the real market—some funds explode into stardom while many quietly implode in the background.
Do you know why good odds can still humble you? Suppose you have a trading model with a 60% accuracy rate. That sounds impressive. But what’s the probability you’ll be wrong at least once in your next 10 trades?
So, there’s a 99.4% chance you’ll be wrong at least once in your next 10 trades. Being wrong is normal, but if that “one wrong” is a big bomb of a trade—especially if you’re leveraged—look out below. Your 60% edge might not protect you from a single disastrous bet.
If you risk too much on each trade, a single mistake can demolish all your gains (or more). So even if you’re mostly right, you can still face ruin. Think of it like going all-in at the poker table with a strong hand—there’s still a chance you’ll lose. And that one chance can wipe you out if you bet everything.
Nassim Taleb calls probability the acceptance of the lack of certainty in our knowledge. Probability teaches us we can’t be 100% sure; we can only manage scenarios. Ironically, the more certain someone sounds in the market, the more suspicious we should be. Overconfidence is a silent killer—especially when luck masquerades as skill.
So, here's the question: How do we stop being just coin-flipping chimps? Let’s see a practical guide:
Assume you’re wrong. Always.
Test for randomness. If your strategy can’t beat a drunkard’s walk, it’s astrology—a few days back, I found out that some traders are actually using that😵💫.
Embrace asymmetry. Seek setups where you can win big but lose small.
Laugh at confidence. The more certain someone is, the louder you should hear “Danger, Will Robinson!”
Remember: We don’t know the future. Even the best quant funds, with entire floors of PhDs, get it wrong a lot of sometimes.
Keep it simple. Period.
I suppose everything mentioned so far sounds familiar, right? That’s exactly how some discretionary traders operate. They guess, the market moves in their favor, and they call themselves geniuses. When it doesn’t, they blame “market manipulation” or “the Fed” or “the news.” Ultimately, if you can’t rule out randomness, you might be basing your decisions on a plastic toy’s cryptic responses.
Just like a Vegas buffet, you might feel full—maybe even too full—but now you have plenty to chew on.
“Remember: If you’re going to gamble—at least do it with your eyes open. And if you lose the house in the process… well, you might want to ask the Magic 8-Ball for a refund.”
The solution: Use a systematic approach, don’t stare at screens, fully automate it, and make sure it has a real edge.
That’s my final fatherly advice. Good luck out there under the neon lights, and keep an eye on your chips. Until next time—trade smart, stay skeptical, and trust the math.
👍 Did you gain valuable insights and now want to empower others in the field?
Appendix - Some of the best quotes from Taleb
Randomness will be dismissed as a determining factor in performance.
Regardless of how refined our decisions are or how adept we become at controlling probabilities, randomness will ultimately dictate the outcome.
Taking risks is essential for achieving extraordinary success—but it is equally essential for failure.
While skills certainly matter, their influence diminishes in environments dominated by randomness.
Our brains are not naturally equipped to process nonlinear dynamics.
People assume that if two variables are causally linked, then a steady input in one should always yield a predictable output in the other.
When events unfold in our favor, we resist acknowledging uncertainty.
We gravitate toward the visible, the familiar, the anecdotal, the narrated, and the tangible—while disregarding the abstract.
The terms "bullish" and "bearish" are often used by those who avoid embracing uncertainty.
Probability extends beyond mere calculations of dice rolls or their complex variations; it represents an acceptance of uncertainty and the development of frameworks to navigate ignorance.
Probability is, at its core, a discipline of applied skepticism.
Probability theory is a relatively recent branch of mathematics, and its application in real-world decision-making remains largely underdeveloped.
Outcomes are asymmetric: those who fail tend to do so early, while survivors persist for extended periods.
When asymmetry exists in outcomes, the average survival time is meaningless compared to the median survival.
Economic "risk takers" are often victims of their own illusions rather than genuine masters of uncertainty. What they perceive as "risk-taking" is frequently just blind engagement with randomness.
People overestimate their knowledge and systematically underestimate the probability of being wrong.
Modest success can be attributed to skill and effort, but extreme success is often a product of variance.
Performance in any domain—whether war, politics, medicine, or investing—should not be evaluated solely on results, but on the cost of alternative outcomes.
Our emotional framework is built for linear causality.
From this perspective, it naturally follows that:
Traders and trading algorithms often misinterpret random or noise-driven price fluctuations as meaningful patterns or trends—meanwhile, sklearn and its machine learning models are having an existential crisis.
This fosters confirmation bias and unwarranted confidence in strategies that succeed due to luck rather than actual predictive ability.