[Quant Lecture] Principles of applied statistics for trading
Quantitative Research for Traders
A structured approach to building and evaluating algorithmic strategies
An ideal sequence guides a trading‐strategy investigation from hypothesis through live deployment. At each stage—strategy design, data measurement, backtesting, and performance interpretation—statistical analysis transforms raw ideas into quantifiable, manageable risk. This framework isn’t merely theoretical; it’s what separates repeatable success from luck-based gains .
What’s inside:
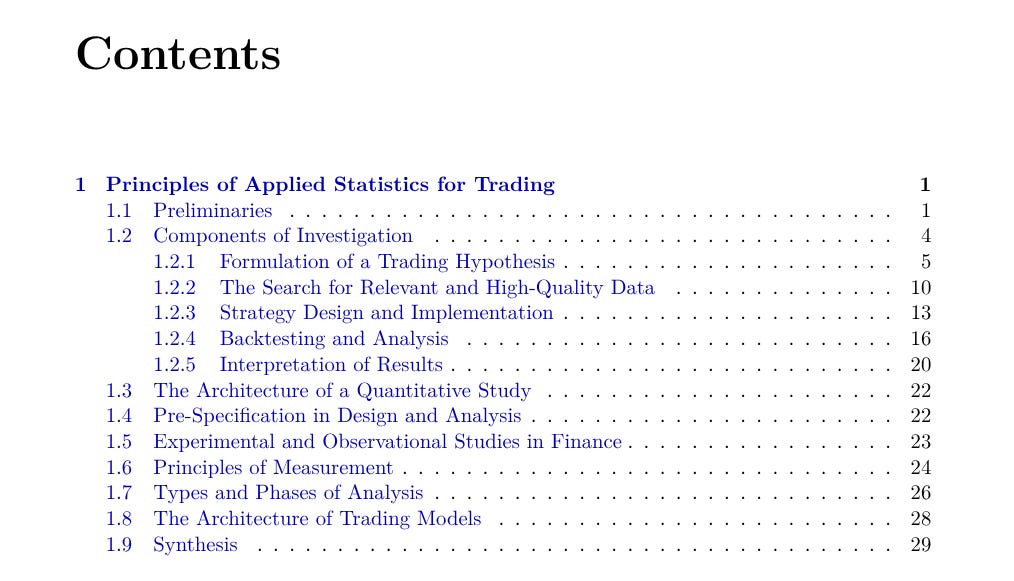
Preliminaries: Establish a step-by-step framework—from idea to live algo—designed to reduce uncertainty and quantify risk at every turn.
Components of investigation: Explore the five pillars of research: hypothesis formulation, data sourcing, strategy implementation, backtesting, and result interpretation.
Formulation of a trading hypothesis: Learn to craft precise, falsifiable conjectures grounded in economic theory, behavioral finance, or market microstructure—Popper’s razor applied to finance.
Data quality and validation: Treat datasets as economic assets. Master point-in-time data management, error correction, and the art of preserving true market extremes while removing measurement artifacts.
Strategy design and implementation: Translate bold hypotheses into concrete rules. Cover universe selection, signal generation, position sizing, portfolio construction, and execution logic—prioritizing parsimony to avoid curve-fitting.
Backtesting and analysis: Subject your strategy to frictionless and realistic simulations, walk-forward tests, and purged cross-validation. Use stationary bootstrap resampling to build confidence intervals and p-values for your edge.
Interpretation of results: Move beyond raw performance to understand economic rationale, regime robustness, and tail-risk drivers. Learn to iterate via rigorous falsification and continuous refinement.


