

Table of contents:
Introduction.
Anatomy of the Taco Trade environment.
Defining the Taco Trade or perpetual dip-buying.
Equities at all-time highs and valuation warnings.
Sentiment and positioning.
The August 1 deadline.
Dissecting the U.S. tariff proposals.
Europe's counter-offensive.
Autos, luxury, and materials.
Yield curve inversions and the great divergence.
The 20-year vs. 30-year inversion.
Interpreting the 2s10s and 10-3mo spreads.
A key holder of U.S. treasuries and a source of potential volatility.
The shifting status of the dollar.
Cross-asset analysis.
Strategic outlook and investment strategy.
Audio Note: Before we begin, remember that if you’re accessing this article through the Substack app, you can listen to it instead of reading it. The MarketOps section is best suited for this format.

Before you begin, remember that you have an index with the newsletter content organized by clicking on the image below.

Introduction
The global financial markets in mid-2025 are defined by a precarious and unsustainable paradox. On one hand, equity markets, particularly in the United States, are exhibiting a state of profound complacency, trading at or near all-time highs with historically low volatility. This environment is underpinned by a behavioral phenomenon created by Trump—where investors have been repeatedly rewarded for dismissing geopolitical threats as mere rhetoric and treating every market dip as a buying opportunity. This learned behavior has pushed valuations to extreme levels, with metrics like the Buffett Indicator soaring past historical danger zones.
On the other hand, a constellation of clear and present dangers looms, largely unpriced by the sanguine equity markets. The most immediate is a geopolitical fulcrum centered on a potential U.S.-EU trade war, with an August 1, 2025, deadline for the imposition of sweeping tariffs. The U.S. has proposed a 30% blanket tariff on EU and Mexican goods, supplemented by punitive sector-specific levies of 50% on copper and 200% on pharmaceuticals. The European Union has responded not with acquiescence but with a meticulously prepared retaliatory package targeting €72 billion of politically sensitive American exports, including aircraft and automobiles.
Beneath the surface, the bond market is sounding a multi-faceted alarm that equities are ignoring. An unusual inversion in the U.S. Treasury curve, where 20-year yields have matched or exceeded 30-year yields, signals deep structural stress related to America's deteriorating fiscal outlook. This is compounded by the recent history of inversions in the more traditional 2-year/10-year and 3-month/10-year spreads, which have been reliable harbingers of past recessions. This great divergence—a euphoric equity market versus a distressed bond market—is a hallmark of a late-cycle environment on the cusp of a regime change.
Before we start, check this presentation from Morgan Stanley:

Anatomy of the Taco Trade environment
The prevailing mood across U.S. equity markets in mid-2025 is one of unwavering optimism, bordering on invulnerability. This sentiment is not born of a flawless economic backdrop but rather a learned psychological response that has systematically rewarded the dismissal of risk. Today we will dissect the components of this complacency, from the behavioral patterns driving it to the quantitative evidence of its extremity.
Defining the Taco Trade or perpetual dip-buying
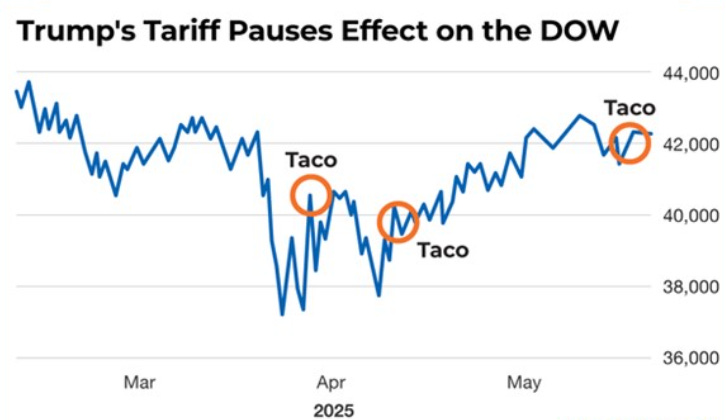
The dominant market narrative of 2025 is the Taco Trade. The acronym, standing for Trump Always Caves Out, encapsulates a market psychology conditioned to believe that any aggressive trade rhetoric or tariff threat from the U.S. administration will ultimately be withdrawn or fail to materialize. This belief has created a feedback loop:
The administration announces tariffs, markets pull back briefly, the threat is delayed or softened, and markets rebound to new highs. Investors who buy the dip are rewarded, reinforcing the validity of the strategy for the next cycle.
This pattern became deeply entrenched over the course of the year. For instance, on July 8, 2025, the White House's decision to delay a set of reciprocal tariffs ignited a 2.5% rally in the S&P 500, with tariff-sensitive sectors like technology and industrials leading the charge.
Later, on July 26, a statement from the White House Press Secretary that downplayed the gravity of the August 1 deadline triggered another surge, pushing equities toward record highs. Each instance serves as a dose of positive reinforcement, teaching the market that complacency is the most profitable strategy.
The result is an environment where pullbacks are no longer perceived as indicators of rising risk but rather as fleeting opportunities to increase exposure at a discount. While this has been a successful tactic, it simultaneously masks the mounting economic costs of the tariffs that have been implemented, which fall disproportionately on U.S. consumers (49%) and businesses (39%). This growing economic pain increases the political difficulty of future rollbacks, making the Taco Trade an increasingly fragile bet.
Equities at all-time highs and valuation warnings
This psychological complacency is reflected in quantitative market data. Major U.S. indices are not just at elevated levels; they are exhibiting a notable lack of volatility, consolidating near their peaks. In early July 2025, both the S&P 500 and the Nasdaq Composite traded within exceptionally narrow 1% ranges while setting successive all-time highs, a technical sign of a market devoid of fear and unwilling to price in adverse scenarios. On July 10, the S&P 500 closed at 6,280.46 and the Nasdaq at 20,630.66, both records.
This price action is occurring atop a foundation of historically stretched valuations. The Buffett Indicator, a metric that Warren Buffett himself has called probably the best single measure of where valuations stand at any given moment, has surged to an unprecedented level of over 208% as of July 2025. This ratio, which compares the total U.S. stock market capitalization to the nation's GDP, is far into the territory that Buffett famously described as playing with fire. For context, the indicator's previous peaks in 1999-2000 and late 2021 preceded major market downturns, including the dot-com bust and the 2022 bear market. The current reading of 200%, based on a total stock market value of $59.10 trillion against an annualized GDP of $29.51 trillion, is approximately 1.8 standard deviations above its historical trend line, signaling significant overvaluation relative to the underlying economy.
This is not an isolated warning. The S&P 500 Shiller Cyclically-Adjusted Price-to-Earnings ratio, another respected long-term valuation metric, is concurrently near its third-highest level in history. Together, these indicators provide a clear, quantitative verdict:
The U.S. stock market is historically expensive, a condition that rarely persists indefinitely and often resolves through a painful reversion to the mean.

Sentiment and positioning
The market's risk-on posture is further confirmed by broad sentiment and positioning indicators. A high percentage of individual assets are trading above their 200-day moving averages, a classic signal of strong market breadth and bullish conviction. This indicates that the rally is not being driven by a handful of mega-cap stocks but has a wider base of support, a feature often seen in confident, mid-cycle markets.
Investor behavior reinforces this view. A common theme in mid-2025 has been a rotation out of recent high-flying winners and into prior laggards. This book profit in winners, buy the losers strategy is characteristic of a market where investors are not fearful of an imminent downturn but are instead seeking relative value to extend gains.
Positioning data tells a more nuanced but ultimately supportive story. The BNP Paribas Equity Positioning Indicator, which tracks the allocation of various investor cohorts to equities, has rebounded from the depressed levels seen earlier in the year but remains in neutral territory.
Paradoxically, this is a bullish signal. It suggests that despite the record-high equity prices, a significant pool of capital remains on the sidelines. This dry powder could provide further fuel for the rally if these neutral or under-invested participants are forced to chase performance, creating a potential "melt-up" scenario even as underlying risks accumulate. The combination of confident sentiment, broad participation, and available sideline capital paints a picture of a market predisposed to move higher, making any potential shock all the more disruptive.
