[INTEL REPORT] Market & investments insights
Analysis of current export trends, tariff impacts, sector winners and losers, sentiment indicators, and key tech valuations

Table of contents:
Introduction.
Divergence in chinese exports and shippping patterns.
U.S. tariff revenue trends and fiscal impact.
Sector performance analysis 2025.
ETF flows and market sentiment.
S&P 500 rebound pattern.
Nvidia and tech valuations.
Audio Note: Before we begin, remember that if you’re accessing this article through the Substack app, you can listen to it instead of reading it. The MarketOps section is best suited for this format.

Before you begin, remember that you have an index with the newsletter content organized by clicking on the image below.

Introduction
As we reach mid-2025, markets are facing some fascinating—and frankly complex—crosscurrents. On one hand, China's export machine is breaking records, but beneath that headline is a clear divergence: direct exports to the U.S. are down significantly, pointing to an evolving game of trade-route chess. Goods are being rerouted through countries like Vietnam, Indonesia, and Malaysia, signaling sophisticated tariff-avoidance strategies. From a quant perspective, this reshuffling isn’t just noise; it's a structural shift that investors need to factor into risk models.
Meanwhile, tariff revenues in the U.S. have hit record highs, offsetting some fiscal strains from earlier tax cuts. Yet, this surge in revenue isn't without costs—namely inflation and potential economic drag. Market sectors are sharply split between clear winners like energy, defense, and cybersecurity, and lagging sectors like consumer discretionary and biotech, highlighting an investor rotation into more defensively positioned assets.
Interestingly, even amid strong market rebounds, investors remain notably cautious, pulling money out of ETFs. This "wall of worry" scenario, characterized by persistent skepticism amid rising indices, sets up a paradox that any seasoned quant recognizes: markets often sustain bullish runs precisely when caution prevails.
Moreover, the rapid V-shaped recovery in the S&P 500 after the year's earlier volatility spike underscores both resilience and fragility. It raises statistical curiosity—does this rapid rebound reflect true underlying strength, or are we due for another volatility spike?
At the center of investor excitement, Nvidia’s meteoric valuation reflects huge expectations around AI-driven growth. While Nvidia commands a dominant market position, quant investors must ask whether current valuations accurately price future earnings growth or if expectations have run ahead of reality, especially relative to peers like AMD, Apple, and TSMC.
Divergence in chinese exports and shippping patterns
China’s overall exports have continued to grow in 2025 even as exports to the United States plunge, indicating a significant trade flow divergence. Chinese ports remain busy—container throughput +7.9% YoY in Jan–Apr—but much of the volume is being redirected to other countries. Evidence suggests China is rerouting goods via Vietnam, Indonesia, Malaysia and others to evade U.S. tariffs.
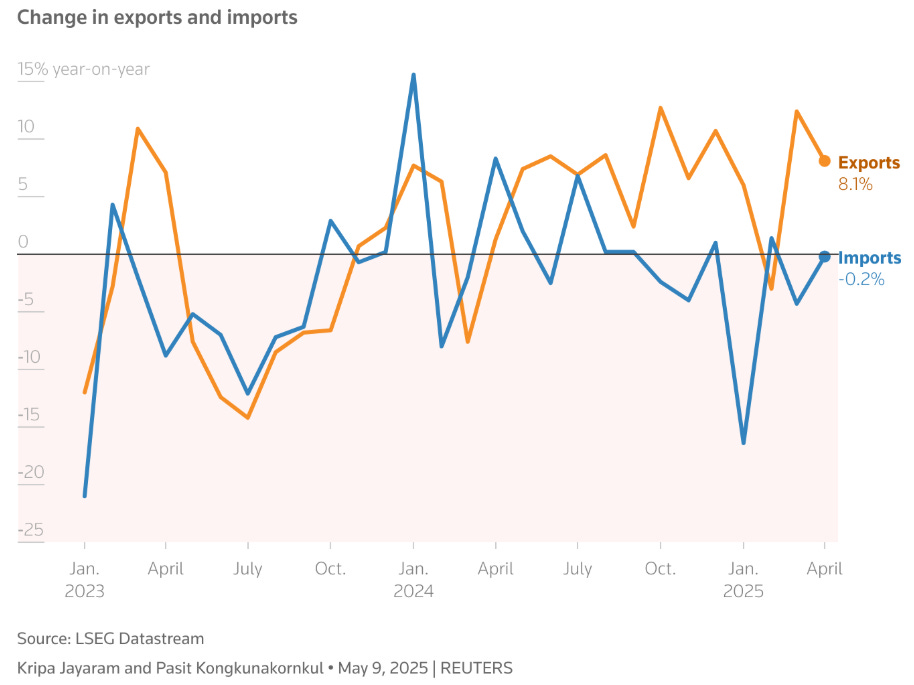
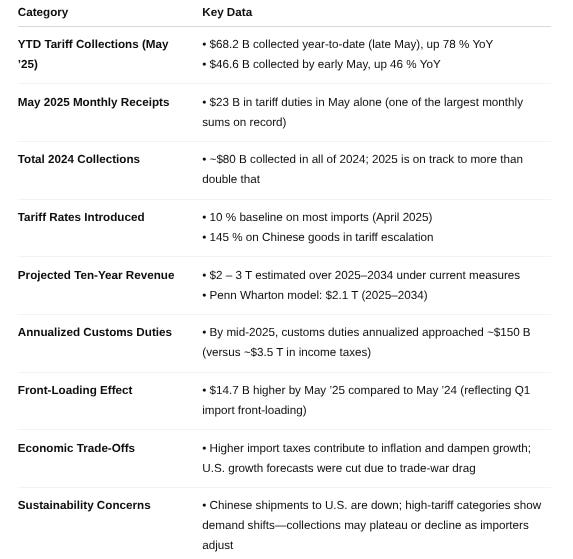
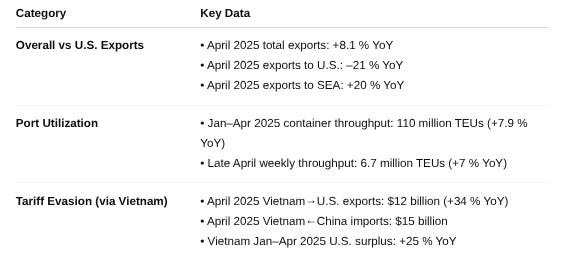
In April 2025, China’s total exports rose 8.1% year-on-year, beating expectations. By contrast, exports to the U.S. fell 21% YoY. This dynamic has widened as U.S. tariffs bite. Exports to Southeast Asia jumped ~20% in the same month, offsetting U.S. declines. The result: China’s export growth remains positive, while its U.S.-bound trade has shrunk sharply.
Despite weaker U.S. demand, Chinese ports are near capacity. Ministry of Transport data show 110 million TEUs handled Jan–Apr 2025, that menas +7.9% YoY. Weekly stats in late April showed 6.7 million containers moved in one week, up ~7% YoY–underscoring resilient throughput. This suggests goods are still flowing out of China, but on different routes.
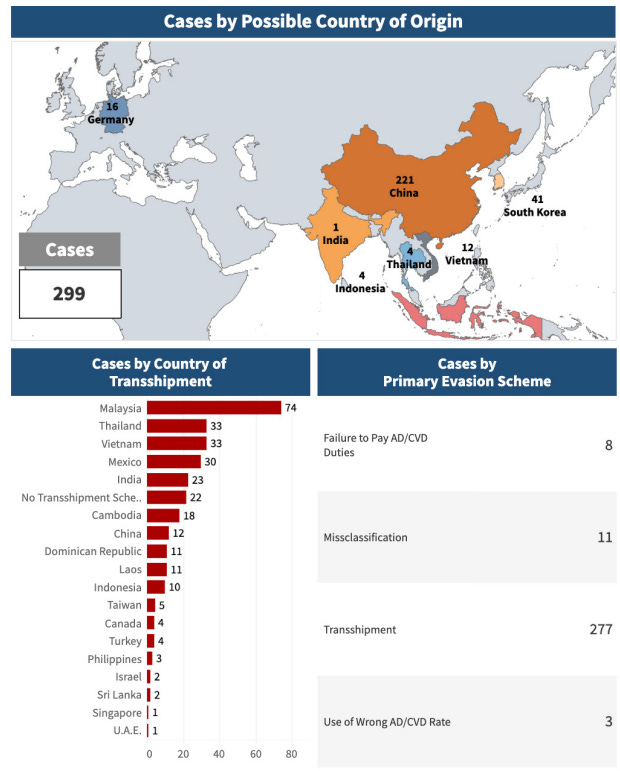
A growing body of evidence indicates Chinese-made goods are shipped to intermediate countries and then re-exported to the U.S. to dodge tariffs. For example, Vietnam’s exports to the U.S. hit a record $12 billion in April, this is +34% YoY, while its imports from China hit an all-time high of $15 billion. Much of this surge is attributed to Vietnam-based manufacturers rushing to export goods—often with Chinese inputs—before new U.S. tariffs take effect. Vietnam’s trade surplus with the U.S. jumped ~25% in the first four months of 2025. Other tariff-friendly hubs like Malaysia, Thailand and Indonesia are reportedly playing similar roles, especially for products like solar panels and electronics that saw transshipment spikes in recent years.
Top categories susceptible to re-routing include machinery and electronics–areas where China’s share of U.S. imports fell as tariffs hit. Notably, Vietnam’s exports of solar panels to the U.S. rocketed from $0.5B in 2016 to $2.5B in 2020, mirroring a surge in its imports of Chinese solar panels. Similar patterns are observed in other goods—e.g. electrical converters via Mexico. These trends point to deliberate country of origin swapping. U.S. authorities have responded with investigations and steep penalties – e.g. plans for tariffs up to 3,521% on solar cells from Vietnam, Thailand, Malaysia, Cambodia—alleging Chinese-origin cells.

EAPA Case Management System - Data on transshipment by country of origin
What are the implications?
China’s headline export strength masks a profound shift in trade routes. The U.S. is importing fewer Made in China goods directly–U.S. imports from China were down ~10–20% in early 2025–but is instead importing more from Asia-Pacific neighbors. This “triangulation” of trade allows Chinese supply chains to reach the U.S. indirectly. It also inflates U.S. trade deficits with countries like Vietnam—Vietnam’s surplus with the U.S. topped $100+ billion in 2024. Going forward, investors should watch for U.S. trade negotiations—e.g. with Vietnam—aimed at closing these loopholes. Any crackdown could alter supply chains again and impact shipping firms and logistics costs.
U.S. tariff revenue trends and fiscal impact
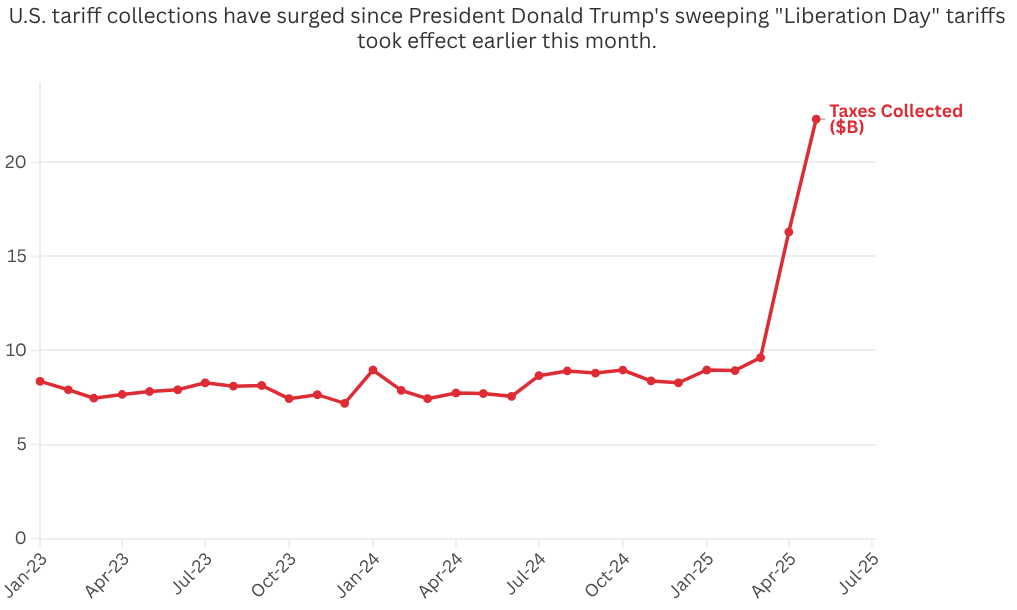
U.S. tariff revenues have surged in 2025 to record levels. The Trump administration’s expansive tariffs—part of reciprocal tariffs policy—are generating tens of billions in extra income for the Treasury, which officials hope will help offset the cost of recent tax cuts. We analyze the uptrend and its significance for fiscal policy:
The U.S. government has collected unprecedented tariff revenues in 2025. As of late May, tariffs brought in around $68.2 billion year-to-date, up 78% from the same period in 2024. For perspective, by early May the take was $46.6B, that is 46% higher YoY and the pace accelerated through May. This puts 2025 on track to easily double the ~$80 billion collected last year. The spike is directly tied to new tariffs that took effect in April: President Trump raised import duties on dozens of countries, 10% baseline on most, 145% on China in a tariff escalation. Importers front-loaded purchases in Q1 and are now paying the piper in tariffs. May 2025 alone saw about $23B in tariff duties, a massive inflow and one of the largest monthly sums on record.
The Treasury and White House explicitly view these tariffs as a revenue source to fund fiscal initiatives. Treasury Secretary Scott Bessent noted that tariff income could be used to pay for extending the 2017 tax cuts and new tax breaks, effectively giving income tax relief funded by import duties. Internal estimates project current tariffs raising on the order of $2–3 trillion over the next decade. This would indeed offset a significant portion of lost revenue from making the Tax Cuts and Jobs Act permanent. For example, Penn Wharton Budget Model finds tariffs from 2025 could raise $2.1 trillion (2025–2034) under current measures. In effect, tariff cash is cushioning the federal budget–a politically salient point as deficits run high.
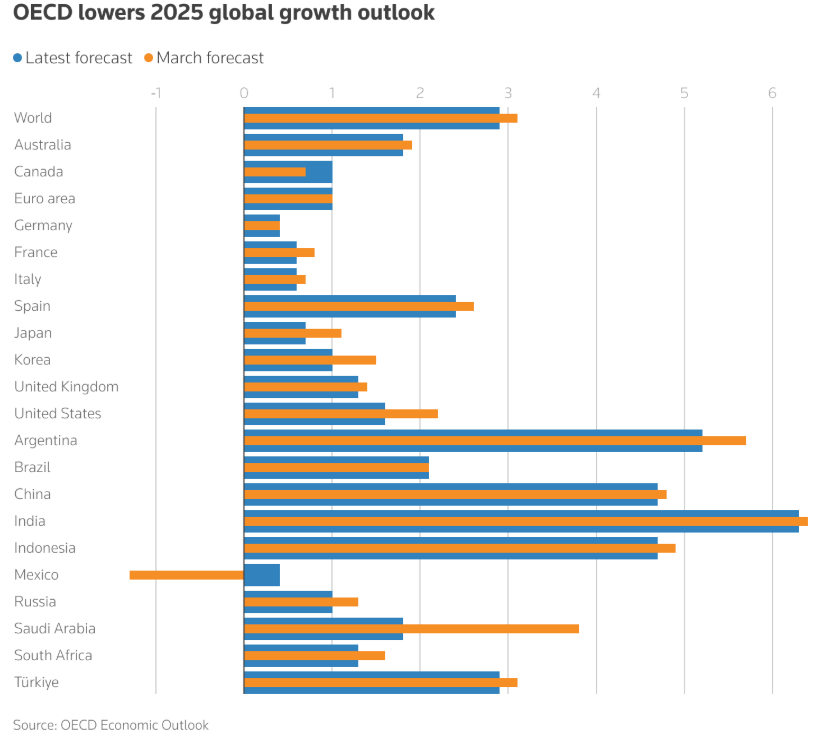
While tariff dollars help on the fiscal front, they come at an economic cost. Higher import taxes contribute to inflation—as companies pass on costs—and can dampen growth. The OECD, for instance, cut U.S. growth forecasts citing the drag from the trade wa. Tariffs are effectively a tax on consumers and businesses. There’s also evidence of trade distortion which can reduce efficiency. Nevertheless, from a pure revenue standpoint the influx is significant–tariff receipts now rival some smaller federal taxes. By mid-2025, customs duties were approaching ~$150 billion annualized, which is meaningful against, say, the ~$3.5 trillion yearly income tax haul.


A key question is whether these elevated collections are sustainable. Often, tariff revenue spikes initially but then levels off or falls as importers adjust—shifting supply chains, using exemptions, etc.. The $14.7B higher than last year jump seen by May reflects front-loading and panic buying ahead of tariffs. We may see slower growth—or even dips—later if U.S. import volumes from tariffed countries decline. Already, Chinese shipments to the U.S. are down, and some high-tariff categories—e.g. furniture, electronics—may see demand substitution. For now, though, tariff cash is flowing at historic highs, giving U.S. policymakers short-term budget breathing room even as negotiations continue to reduce trade barriers.