

[INTEL REPORT] Valuations, low-vol ETFs & macro drivers
How modest declines reveal deeper economic uncertainties and shape investor behavior

Table of contents:
Introduction.
The current context.
Valuations and expectations in a volatile environment.
Low-volatility ETFs and the influence of political declarations.
Imports, GDP, and seasonality.
Audio Note: Before we begin, remember that if you’re accessing this article through the Substack app, you can listen to it instead of reading it. The MarketOps section is best suited for this format.

Before you begin, remember that you have an index with the newsletter content organized by clicking on the image below.

Introduction
Financial markets have displayed notable shifts in recent weeks. Each new trading session often begins with declines across major indices—from the Nasdaq’s 3% drop to the Russell 2000’s roughly 1% dip—prompting concerns that go beyond the magnitude of the fall. The deeper worry is what these pullbacks might imply about the overall economic climate and investor sentiment.
Historical data suggests that corrections of 3%, 5%, or even 10% are not out of the ordinary, especially during a bull market that has been ongoing since October 2022. While such fluctuations can appear alarming, they frequently serve as routine adjustments after sustained upward moves. The real trigger for market anxiety often lies in the catalysts—economic indicators, political declarations, or shifts in global trade—that can spark fear and amplify the impact of what might otherwise be seen as standard market behavior.
Let’s understand these dynamics in detail and assess why seemingly modest declines sometimes trigger widespread concern, and how the market may find its footing as conditions evolve.
The current context
In recent weeks, each start of the trading week has opened in red. We observe notable declines across several indices:
The Nasdaq dropping by about 3%.
The Russell 2000 facing roughly a 1% decline.
And while the Dow Jones—thanks to its diversified composition—shows a bit more resilience, the overall sentiment remains cautious.
However, the market isn’t really frightened by the size of these drops; rather, it’s the fear of what these drops imply—about the underlying economic conditions and investor sentiment—that fuels panic.
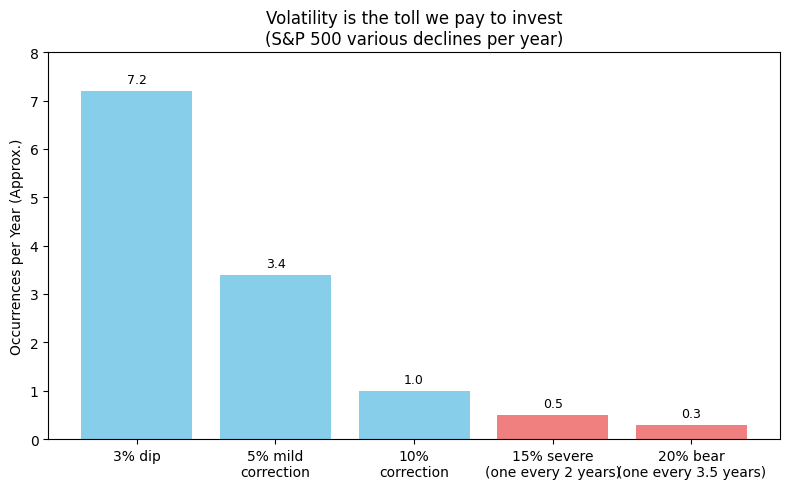
This is translated into volatility. Volatility, often summarized as the price we pay for investing, represents the fluctuation in asset prices. The well-known chart from Ryan Detrick illustrates that these corrections aren’t anomalies; they’re a regular part of market behavior. For example:
3% Corrections: Occur about 7.2 times per year. These are akin to minor dips—a bit like encountering several small bumps during a ride.
5% Corrections: Happen roughly 3.4 times a year. These moves are more pronounced but still within the expected range.
10% Corrections: Occur about once a year. Though significant, these corrections serve as a natural rebalancing mechanism.
15% and 20% Drops: Are far rarer, happening roughly once every 2 and 3.5 years respectively—comparable to those rare, intense moments on the roller coaster that are memorable yet infrequent.
In the current cycle, which is part of the bull market that began in October 2022, we’re witnessing corrections around 8-10%. While these figures might seem alarming at first glance, they are well within historical norms. For instance, after sustained upward moves, it is typical to see these adjustments as the market breathes and rebalances. Importantly, the market doesn’t panic simply because it falls—it’s more the reaction to the underlying catalysts, such as economic data and political declarations, that stoke fear.

Valuations and expectations in a volatile environment
Even amid notable corrections, market valuations continue to remain at high levels. This persistence suggests that, despite short-term volatility, investors maintain an overall positive outlook for the long-term growth of companies.