

[WITH CODE] Data: Data cleaning and preparation
Can we validate trading strategies with poor data?

Before you begin, remember that you have an index with the newsletter content organized by clicking on “Read the newsletter index” in this image.

Introduction
Envision yourself as a bold fortune hunter, standing at the threshold of a vast mine. In your hands, you clutch a weathered treasure map—its edges worn and creased, vital markings smudged by water, and entire portions devoured by nibbling rodents. You know riches lie within, but your only guidance comes from faded scrawls and tear-soaked footprints.
Now substitute the following:
You → A trader or quantitative analyst.
Treasure map → Your set of historical market data.
Gold → Profits or that magical edge in the markets.
Welcome to the challenge of validating trading strategies with incomplete, noisy, or otherwise suspicious data—poor data. The question we tackle in these many, many words is simple: Can we confirm a trading strategy’s worth if the data is incomplete, messy, or downright suspicious?
Let's take the grand tour of low-quality data!
Before you can even think of validating a strategy, you need to know your adversary. Poor data isn’t a single, monolithic beast. It’s more like a band of rowdy ruffians—each with its own quirks and ability to trip you up at inopportune times. In this section, let’s examine the typical culprits:
Missing values
High noise
Short time spans
Misaligned or dirty data
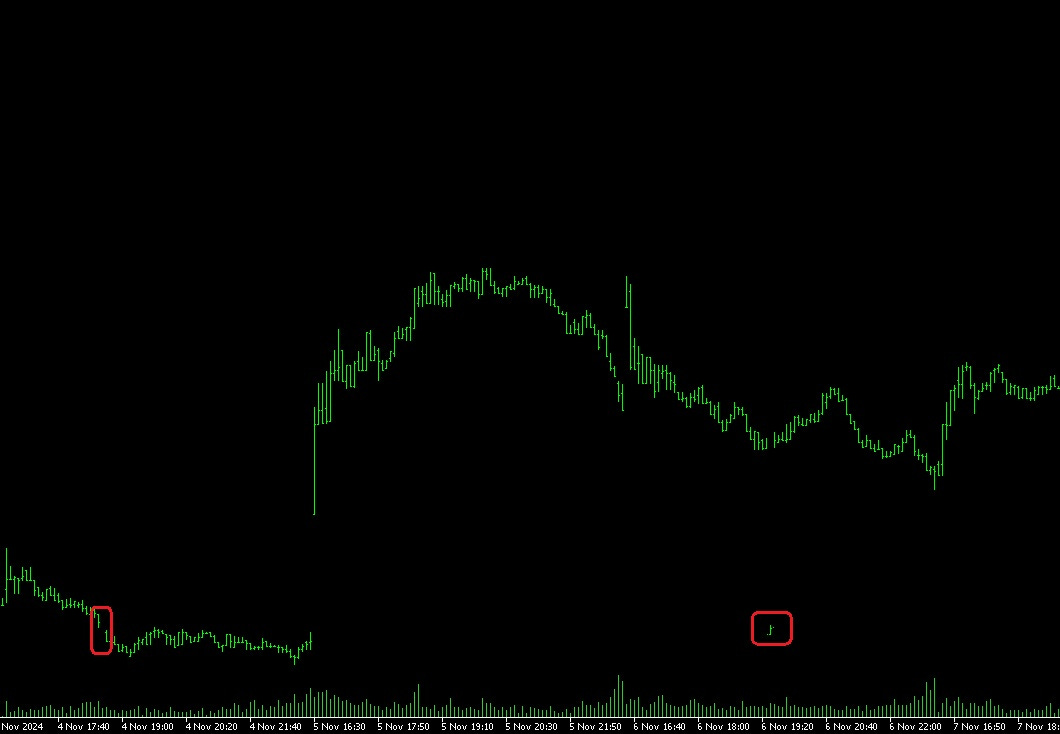
We start with the first one. Ever see a cheese with holes so large you can peer through it like a telescope? That's often how broker data looks. You might have entire days with no recorded prices, incomplete volume information, or entire columns that vanish for a week. Check this random chart and pay attention to the red circles—what the hell is this!? 🤨 I feel like the meme of the elephant and the penguin. And check out those hairy candles... WTF!? I encourage you to drop a comment if you find anything else!
Among some common examples, we see:
Suspended trading: When an exchange halts a stock for volatility.
Outage or glitch: An API fails to deliver data for a certain window of time.
Historic data gaps: The asset didn’t exist or wasn’t traded.
Missing values can wreak havoc. If you feed them directly into a strategy’s calculation, you could end up with nonsensical signals or random error messages. Therefore, any validation must handle these holes wisely. If you look closely, you can see day 1... then day 2 disappears, day 3 reappears, day 4 is gone again—and so on, until your chart looks like an avant-garde painting.
Causes: System outages, trading halts, or your data vendor just dozed off.
What is the effect of this? Your algorithm sees random gaps and might mistake them for stable trends, akin to a person believing their cat teleported just because it left the room.

The next one is what I like to call Thunder in the dataset. Imagine a heavy metal concert with thunderous guitars, booming drums, and someone screaming at the top of their lungs. Trying to hear a whisper in that environment is tough. In the same way, noisy data can bury the faint signals you’re after.
Data noise is essentially the presence of random fluctuations and distortions that blur the “true” price or value. Maybe a single post from an influencer triggers a price spike that reverts quickly, or a day trader with deep pockets pushes the price around just for fun. You see patterns that might just be coincidences. Or you might miss patterns because they get swallowed by the noise. Good luck. That’s basically what “noise” is in a dataset. You suspect there’s a hidden pattern, but all you hear is chaotic shrieking and thunder-like drum solos.
For examples: Meme-stock mania, day-trader tweets, or random microstructure noise.
What is the consequence? Even if a legit pattern is there, it’s overshadowed by the raucous noise. You might as well be searching for a needle in a head-banging haystack.

Ok, and what about the third one? I like to call this one the mayfly problem. A mayfly famously lives for only a few hours or days. Similarly, you might have only a few weeks or months of data for a new cryptocurrency or a newly listed stock. Validating a strategy on such a short timescale could be akin to concluding an entire year’s climate from a single afternoon’s weather:
For example: A newly launched altcoin might only have 3 months of trading history.
What's the risk? You might see a massive rally and assume it’s the norm, when it’s just an initial hype wave.

And the last one—no clever labels, just raw, unfiltered dirty data. Or wait, wait—better yet, muggle data. So, sometimes data arrives in jumbled order, or with incorrect timestamps. Attempting to stitch it into a coherent time series is like trying to solve a jigsaw puzzle with pieces from different sets—and someone might have scribbled on them with crayons.
For example: Timestamps in different zones, or volume data that arrives late, or poorly formatted “M/MM/DD/YYYY” fields.
What’s the result? Your strategy tries to compare apples to pineapples, generating pineapple-applesauce at best.

Now that we’ve classified our culprits, let’s talk about why the concept of validating a trading strategy is so critical in the first place. After all, if we’re dealing with incomplete or unreliable data, how can we possibly claim success or identify failure? Moreover, why should that matter when it comes to validating strategies?
Visualize you have a brilliant new idea for a strategy: buy a stock whenever Jeff Bezos posts about space travel or Blue Origin, and sell an hour later. Sure, it sounds whimsical, but how do you prove it has any real merit?
Validation is the process of checking whether a strategy that seems promising in your imagination might hold up in more realistic conditions.
With poor data, you’re attempting to glean stable and consistent results from an unstable foundation. This is somewhat akin to trying to guess what shape a puzzle piece should be even when half the edges are missing.
In robust scenarios, we gather large, clean data sets, meticulously slice them into a training portion (to adjust or create the strategy’s parameters) and a separate set for testing or evaluation. But with poor data, you’re short on many of these resources. You must figure out how to patch the data, gather alternative data, or apply specialized techniques to minimize the risk of concluding nonsense.

Let’s now pivot into the realm of mathematics to help us see how to approach the problem of incomplete or chaotic data in a more formal way. I promise only a little bit of math, so breathe easy. I won’t bury you in labyrinthine formulas. However, some fundamental concepts will illuminate how to tackle gaps and noise.
A common (and mercifully simple) approach is to assume that we have a “true” or latent price P(t), which we unfortunately don’t get to see perfectly. Instead, we observe:
Here, ϵ(t) represents noise—an unpredictable term that could be anything from microstructure noise to weird anomalies. The magnitude of this noise (think of it as how loud the thunder is) greatly influences how messy your data looks.
When ϵ(t) is large, your chart starts to look like a seismograph in an earthquake zone.
When ϵ(t) is small, your data is relatively tidy, and you can more confidently identify signals.
Now is the time to fill the holes with liner interpolation. Let’s say you have a time series with some missing points. One basic approach is linear interpolation, which is fancy talk for draw a straight line between two known points and guess the missing ones along that line.
If you know P(t1) and P(t3), but not P(t2), you might fill in the blank with:
Is it perfect? Probably not—markets don’t usually move in perfect lines. But it’s better than shrugging your shoulders and scribbling ¯\_(ツ)_/¯ in place of real data.
There are other interpolation methods like:
Spline interpolation: Smooth curves that try to respect local slopes.
Polynomial interpolation: Higher-order polynomials that can overreact to extremes.
Piecewise constant: You just “hold” the last known value until a new one appears—like imagining the price doesn’t change at all during missing intervals.
Feel free to choose the most suitable for you.
import numpy as np
import pandas as pd

# Example time series with missing values
dates = pd.date_range("2025-01-01", periods=6, freq="D")
prices = pd.Series([1000, np.nan, 1020, np.nan, np.nan, 1060], index=dates)

print("Original Series with Missing Values:")
print(prices)

# Interpolate the missing data linearly
interpolated_prices = prices.interpolate(method='linear')

print("\nInterpolated Series:")
print(interpolated_prices)
Ok! Now that we have an idea of how to handle missing data and a sense of what noise does, let’s see some of the more specialized strategies for improving the state of your poor data before you attempt any serious validation.
Sometimes, you can’t get your hands on cleaner or larger data. The markets you care about might be too new, or perhaps your data vendor had system meltdowns. What then? You have to roll up your sleeves and do your best with what’s available.
If your historical data is limited or hole-ridden, you can attempt to generate more or “similar” data that mimics the original set—known as data augmentation. This process is like creating new treasure maps based on the shapes of your old ones:
Random walk extensions: If your data ends on Tuesday, you can generate plausible values for Wednesday, Thursday, etc., by adding random increments around the last known trend.
Synthetic time series models: Tools like generative adversarial networks—in other post we will review more proprietary efficient methods.
Here's an example. In the upcoming posts, I will refine this approach to construct more tailored market scenarios: